You’d think that after eighty years of pinging the ocean floor with sonar, we’d have every square mile of it figured out by now. We don’t. Ships keep re-scanning the same patches of seabed, decades apart, and pulling up the exact same strange, unexplained signals every single time.
These aren’t internet rumors or fringe theories floating around a forum somewhere. They’re sitting in official navigational charts, buried inside seismic survey databases, and logged by research vessels that never coordinated with each other, yet somehow keep confirming the same weird readings.
From ghost seafloors that rise and fall with the sun to circular formations that keep reappearing on totally separate expeditions years apart, here are 11 seabed mysteries hiding in plain sight on sonar records, and why almost nobody has bothered to go check them out.
#1 – Phantom Bottoms That Move With the Sun
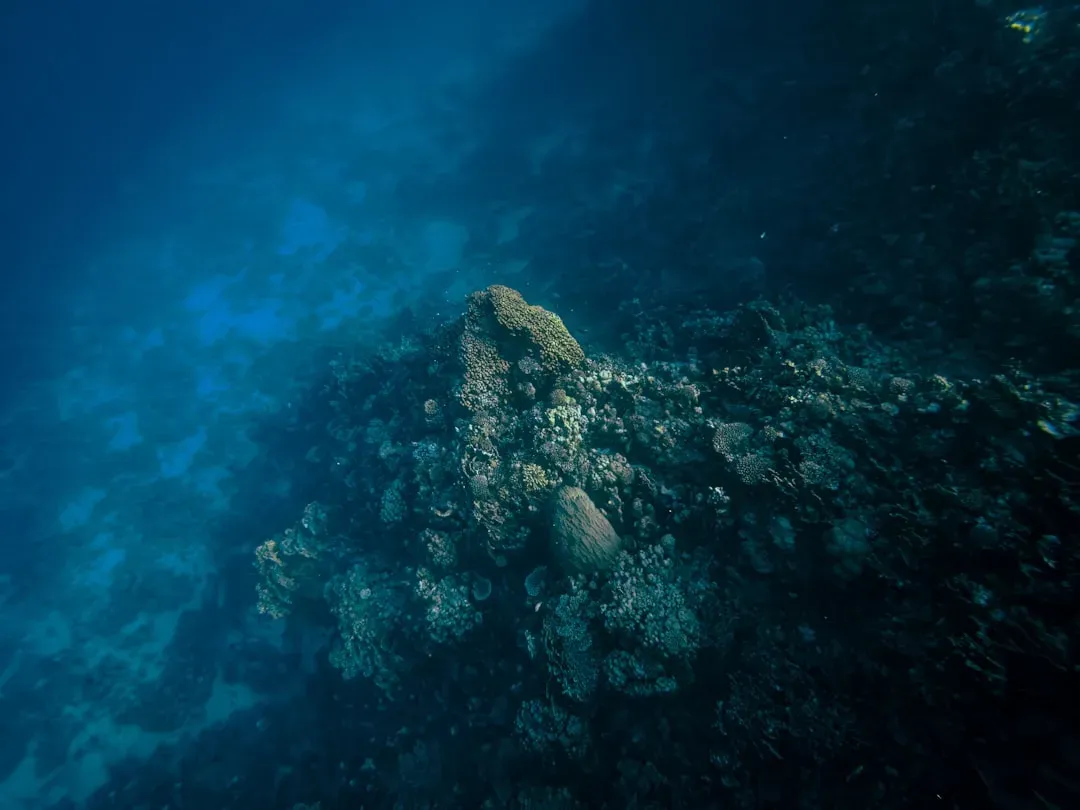
During World War II, sonar operators aboard ships across multiple oceans kept picking up a second seafloor. It was a solid, reflective layer sitting hundreds of meters above the actual bottom, and it behaved like clockwork. It thickened and hardened during daylight hours, then thinned out or disappeared after dark, only to return again the next morning.
Naval charts eventually stamped these readings “ED,” short for existence doubtful, and the matter got quietly shelved. Some of those markings are still printed on official charts today, decades later. The single most surprising fact is that this phantom layer could stretch for miles yet shift its depth every single day, and nobody ever circled back to close the loop.
Fast Facts
- As of 2026, only about 28.7% of the global seafloor has been mapped with modern high-resolution multibeam sonar.
- Even in U.S. waters, roughly 56% remains mapped to that standard, despite decades of naval and research surveys.
- Explorers have physically seen less than 0.001% of the deep ocean floor with their own eyes or cameras.
- Many WWII-era “ED” notations are still printed on navigational charts today, unresolved.
#2 – Gulf of Mexico Amplitude Hotspots
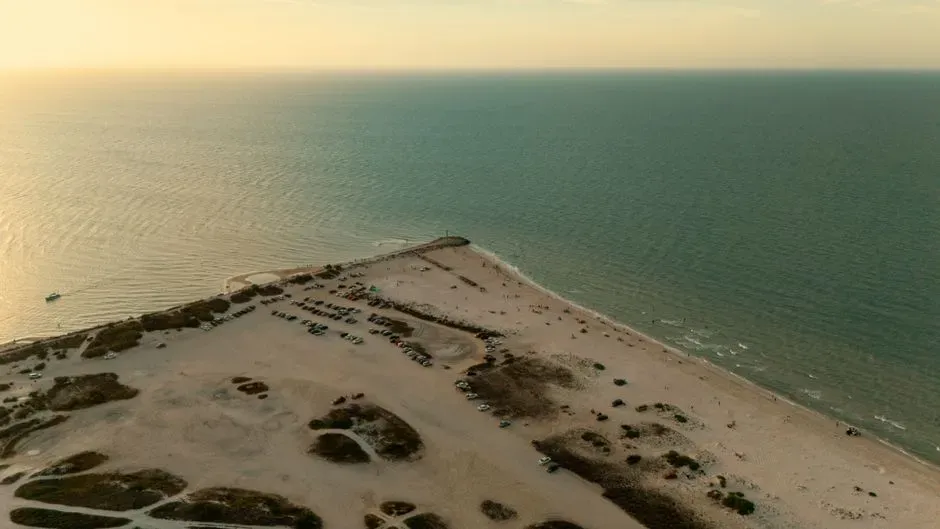
Since the late 1990s, seismic surveys have flagged nearly 37,000 water-bottom amplitude anomalies scattered across the northern Gulf of Mexico. They show up as unusually bright or oddly reversed signals across overlapping 3-D data sets that together cover more than 230,000 square kilometers of seabed.
Plenty of these align with known fluid pathways and known seeps, which makes sense. But hundreds of them sit in spots with no confirmed seep, no hardground, and no explanation on file. Researchers have spotted vertical “chimneys” beneath many of these hotspots suggesting fluid is actively migrating upward right now, yet only a small fraction have ever been checked with an ROV or a physical core sample.
#3 – Circular Rim-and-Center Formations
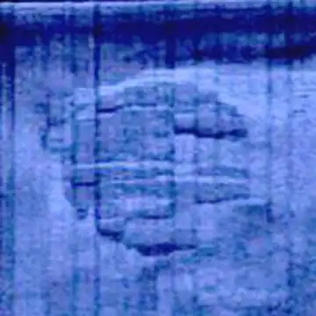
Repeated side-scan passes through the northern Baltic Sea have captured the same roughly 60-meter circular feature, complete with a raised rim and a flatter center, on multiple separate trips. It first appeared in 2011, showed up again on follow-up lines the following year, and sparked genuine speculation before samples eventually pointed toward glacial erratic rocks.
Here’s the part that keeps this one interesting: similar circular returns have turned up in other northern surveys entirely on their own, with no coordinated re-visit between teams. The most surprising detail is how the exact same geometry keeps registering on independent expeditions that have no idea the others found it too.
#4 – Shallow North Sea Depression Fields
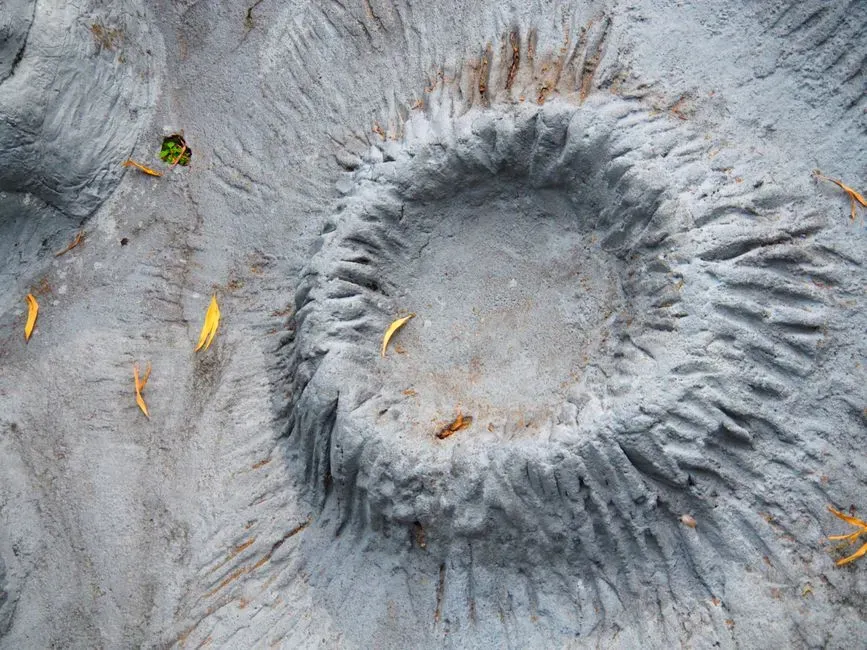
Modern multibeam mapping has revealed tens of thousands of shallow, crater-like pits scattered across the German Bight and the wider North Sea. Each one averages just 11 centimeters deep, and they cluster suspiciously close to known sand-eel habitats rather than anything resembling a fluid vent.
Early interpretations blamed escaping methane gas, which made for a dramatic headline. Higher-resolution mapping later tied the pits to feeding behavior instead. The overlooked part of this story is bigger than the North Sea itself: millions of similar depressions on seabeds around the world may have been misclassified as geological features for decades, simply because nobody looked closely enough.
#5 – Gas-Flare Clusters That Never Stop Bubbling

Side-scan and multibeam records from several ocean margins keep showing recurring water-column flares rising from the exact same seabed patches, season after season. Along the Svalbard margin and in parts of the Gulf, these flares show up right alongside temperature or methane spikes, which should be a flashing red light for researchers.
Instead, most of these sites rarely trigger long-term monitoring. The most surprising fact is that some of them have maintained steady, near-constant bubbling across decade-scale observations without a single dedicated seep ecology study ever being launched to find out what’s really going on down there.
#6 – Hydrothermal Plume Echoes That Keep Reappearing
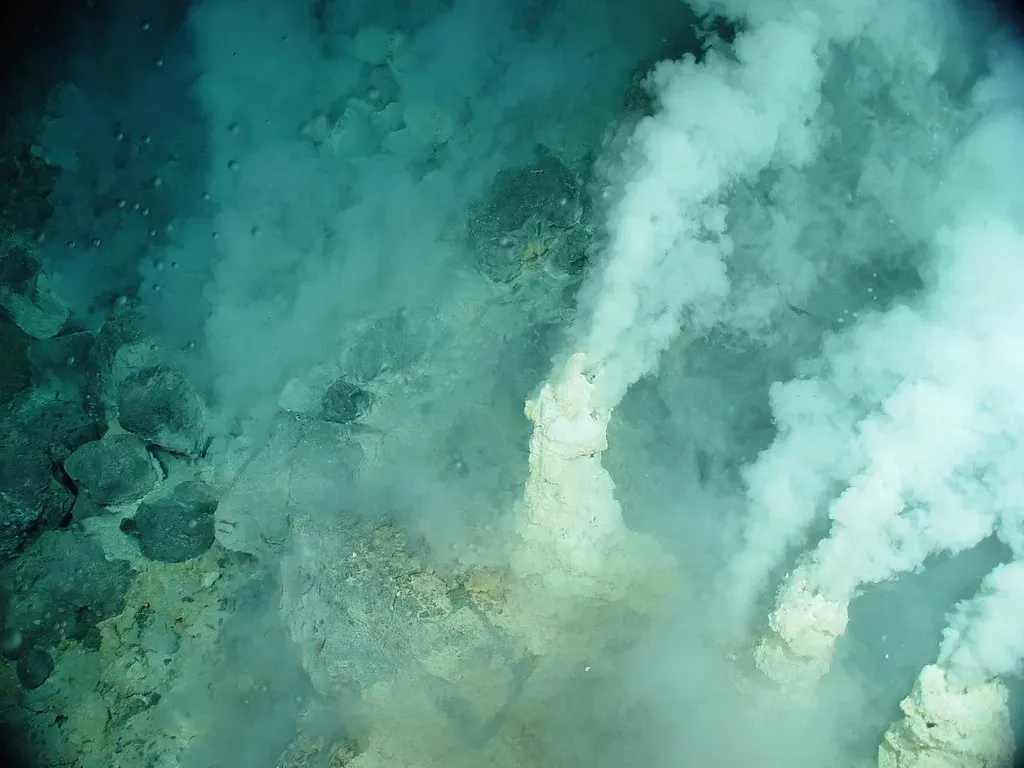
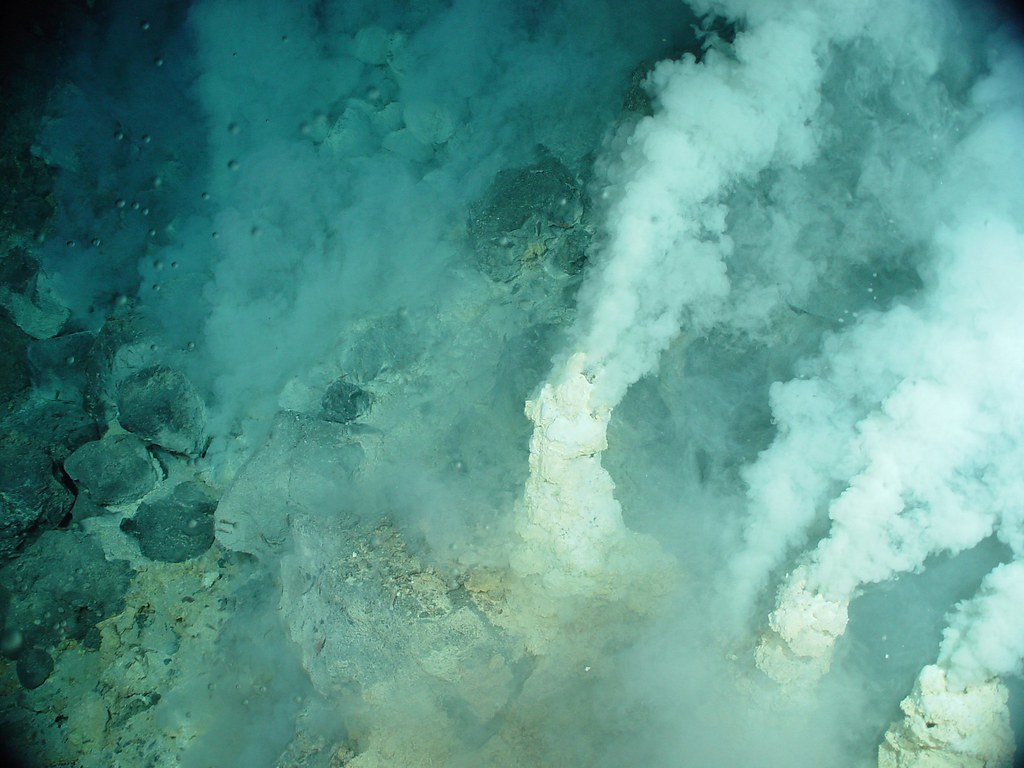
AUV-mounted side-scan sonar has repeatedly imaged strange, filamentous, hyperbolic shapes rising above known hydrothermal vent fields. These aren’t sonar glitches. The shapes line up with real temperature and pH spikes recorded on the very same passes, confirming they’re genuine plumes of superheated, mineral-rich water.
The catch is that many smaller or intermittent vents never get a second look with high-resolution acoustic gear. The detail that stands out most is how the same plume shapes keep reappearing on successive AUV runs, over and over, without a single follow-up geochemical study to explain the pattern.
Worth Knowing
- AUV-mounted side-scan sonar has captured the same filamentous plume shapes on repeated passes over known vent fields.
- Temperature and pH readings taken during the same passes confirm the plumes are real, not sonar artifacts.
- Smaller or intermittent vents rarely get a second acoustic survey once initially logged.
- No dedicated geochemical follow-up has ever explained why the same shapes keep reappearing.
#7 – Manganese Nodule Fields That Sound Backwards
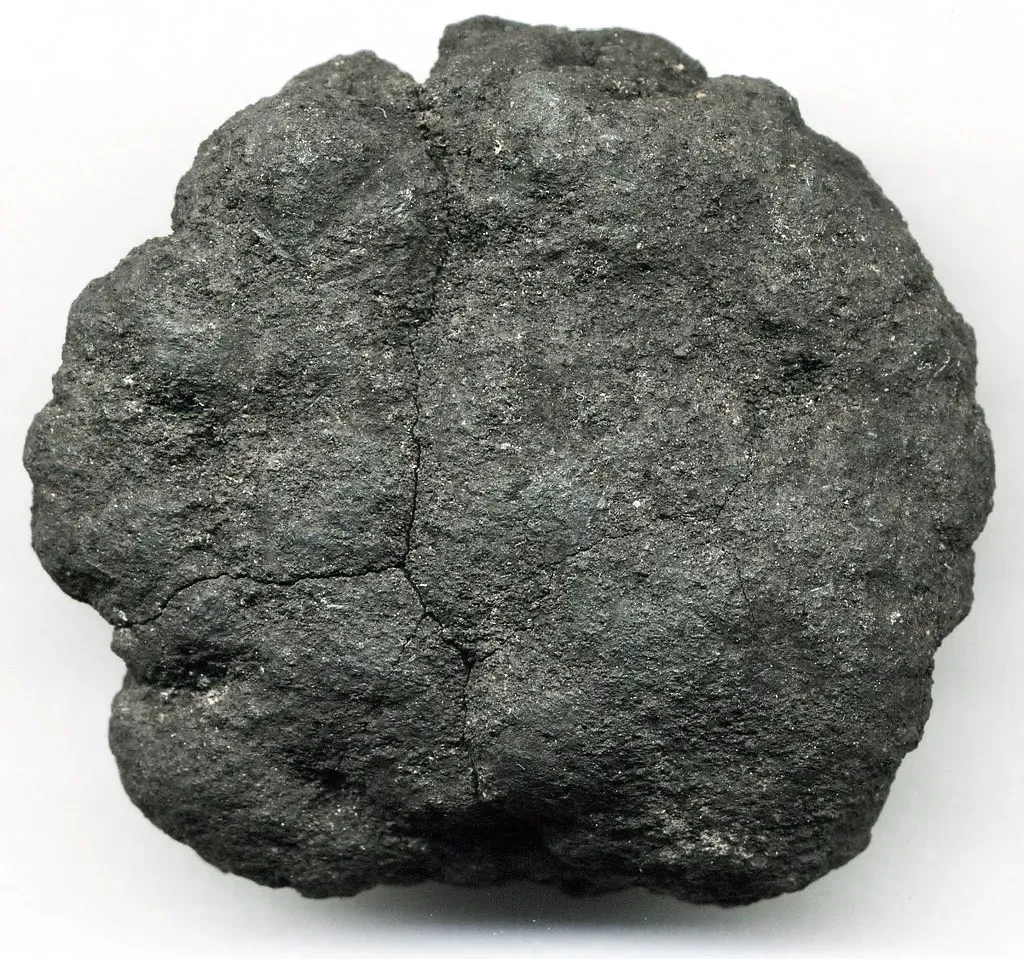
Between the Clarion and Clipperton fracture zones, surveys keep turning up sonar patterns that don’t make sense on paper. In spots where nodule density should be highest, the backscatter comes back oddly flat, thin, or patchy, and doesn’t match what’s actually sitting on the seafloor.
This pattern has repeated across multiple expeditions without any dedicated ground-truthing campaign to sort it out. The most surprising element here is almost backwards from what you’d expect: nodule-rich zones sometimes sound acoustically “quiet,” while plain sediment areas light up the sonar like they’re hiding something.
#8 – Ice-Plowmark Furrows Nobody Bothers to Date
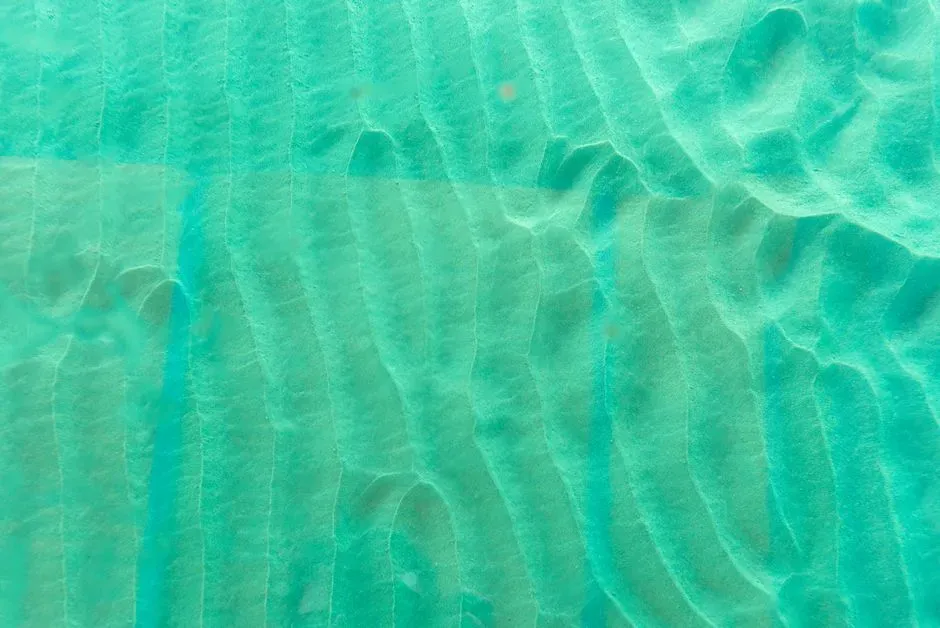
In Arctic and sub-Arctic basins, sub-bottom profilers keep recording hyperbolic echoes bouncing off long, linear furrows carved into the seabed by ancient grounded ice. These grooves show up consistently, crossing line after line of survey data, in survey after survey.
Yet once the initial mapping pass is done, almost nobody circles back to pin down their exact age or how they relate to modern currents. The overlooked reality is that many nautical charts still flag these furrows as potential navigational hazards rather than what they really are: frozen records of an ice age nobody has bothered to properly read.
At a Glance
- Sub-bottom profilers register hyperbolic echoes from long, linear furrows across Arctic and sub-Arctic seabeds.
- These grooves were carved by grounded ice during past glacial periods.
- Many nautical charts still list them only as potential hazards, not as dated geological features.
- Almost no survey team returns to precisely date the furrows or link them to modern current patterns.
#9 – Unexplained Bright Spots With No Source

Both industry and academic 3-D seismic surveys frequently flag isolated high-amplitude bright spots sitting right at the seabed horizon, with no obvious gas, fluid, or hardground to account for them. Vertical profile checks sometimes show no chimney at all, no clear migration path, nothing. The signal is just there.
Overlapping surveys confirm these spots aren’t a one-time fluke; they persist across years of repeated data collection. The single most surprising fact is how many of these bright spots have never once been visited by a submersible or sampled with a corer, despite showing up reliably enough to plot on a map.
We have seen more of the surface of Mars than we have of the depths of our ocean.
Sylvia Earle
#10 – Charts Still Marked “Existence Doubtful”

Hundreds of historical echo-sounder reports labeled “ED,” for existence doubtful, still sit on official navigational charts because no later survey has ever definitively disproved them. Many trace back to the same false-bottom or scattering-layer misreads that confused WWII sonar crews decades ago.
The notations survive simply because modern multibeam coverage remains patchy in remote ocean basins. The detail that keeps this mystery alive is unsettling on its own: some of these doubtful shoals sit directly beneath modern shipping lanes, still unresolved, still uninvestigated, still just a footnote on a chart.
Quick Compare
- WWII-era readings: False bottoms blamed on scattering layers, stamped “existence doubtful.”
- Modern coverage: Multibeam mapping still patchy across remote ocean basins.
- Shipping lanes: Some doubtful shoals sit directly beneath routes used today.
- Status today: Still unresolved, still just a footnote on the chart.
#11 – Fake Seafloors That Keep Fooling Different Ships

In several deep ocean basins, single-beam and multibeam sonar have logged apparent bottom returns sitting shallower than the true seafloor, over and over, on repeated transits. These readings often line up with known biological scattering layers or trapped gas.
But the exact cause at each individual site almost never gets a targeted re-examination once the initial anomaly gets logged and filed away. The most surprising pattern of all is that the same spurious depth keeps registering on completely independent vessels, decades apart, as if the ocean itself is repeating the same trick on everyone who asks.
The Bottom Line
![The Bottom Line ([1] National Geophysical Data Center: Water Column Sonar Data Collection, NOAA., Public domain)](https://nvmwebsites-budwg5g9avh3epea.z03.azurefd.net/dws/892c8f88b5644eebf304d39347446130.webp)
Here’s the uncomfortable part nobody likes to say out loud: this isn’t a technology problem. We have sonar precise enough to spot a car-sized boulder sitting at the bottom of the Mariana Trench. What we don’t have is the ship time, the funding, or the institutional curiosity to go back and simply look twice.
Every single anomaly on this list has been recorded more than once, by more than one crew, using more than one kind of equipment. That’s not a glitch. That’s a pattern demanding an answer, and right now the deep ocean is winning by default, because chasing pipelines and shipwrecks pays the bills, and chasing curiosity doesn’t.
Did we miss one that keeps showing up in your own data or charts? Drop it in the comments.