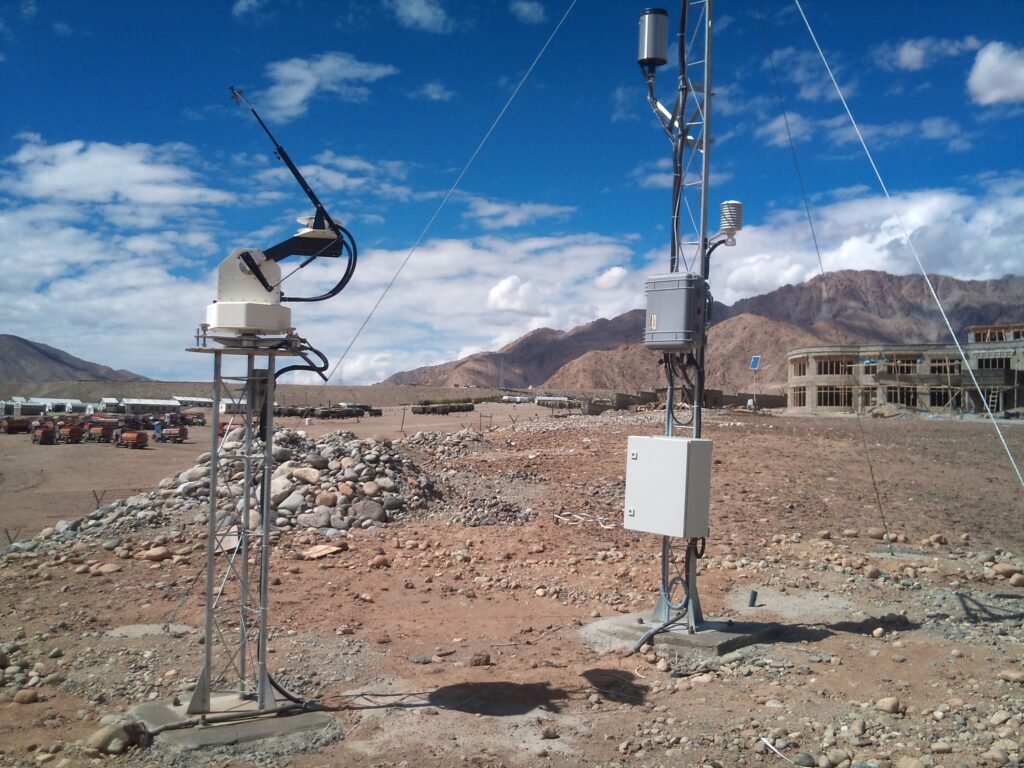
Most people think rain just “shows up.” One minute it’s dry, the next you’re sprinting for cover, cursing yourself for leaving the umbrella at home. But meteorologists know better: the atmosphere starts changing hours – sometimes days – before a single drop falls, and it leaves a trail of measurable evidence the whole way there.
Barometers twitch. Hygrometers spike. Radar catches moisture falling from clouds that hasn’t even reached the ground yet. None of this is guesswork, and it has nothing to do with folklore about aching joints or curling hair. It’s cold, hard instrumentation catching the sky red-handed, mid-decision, before it ever commits to rain. Here’s what actually happens in the air before a storm – and the tools built to catch it in the act.
#1 – Barometric Pressure Starts Falling Before You Feel a Thing
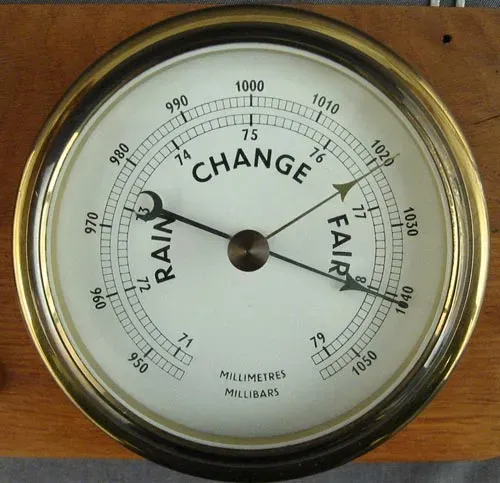
A falling barometer is the single most reliable early warning sign meteorologists trust, and it’s been used since the 1600s. As a low-pressure system approaches, air begins rising rather than sinking, and that upward motion is what eventually cools moisture into clouds and rain. The barometer doesn’t measure the rain – it measures the cause of the rain, which is why it reacts first.
What’s surprising is how far in advance this shows up. A sharp or steady pressure drop over 3 to 6 hours often predicts precipitation before a single cloud looks threatening.
A fast, sudden pressure crash usually signals stronger, more sudden storms, while a slow decline points to a longer, soakier system. Aneroid barometers and digital sensors in home weather stations track this in millibars or inches of mercury, and even smartphones with built-in barometers can pick up the trend.
This is also why sailors and pilots have obsessed over barometric readings for centuries – pressure is a preview of what’s coming, not a reaction to what already happened. It’s arguably the most “boring but genius” instrument in meteorology, quietly doing more predictive work than flashy radar ever gets credit for.
#2 – Relative Humidity Climbs Long Before the First Drop Falls
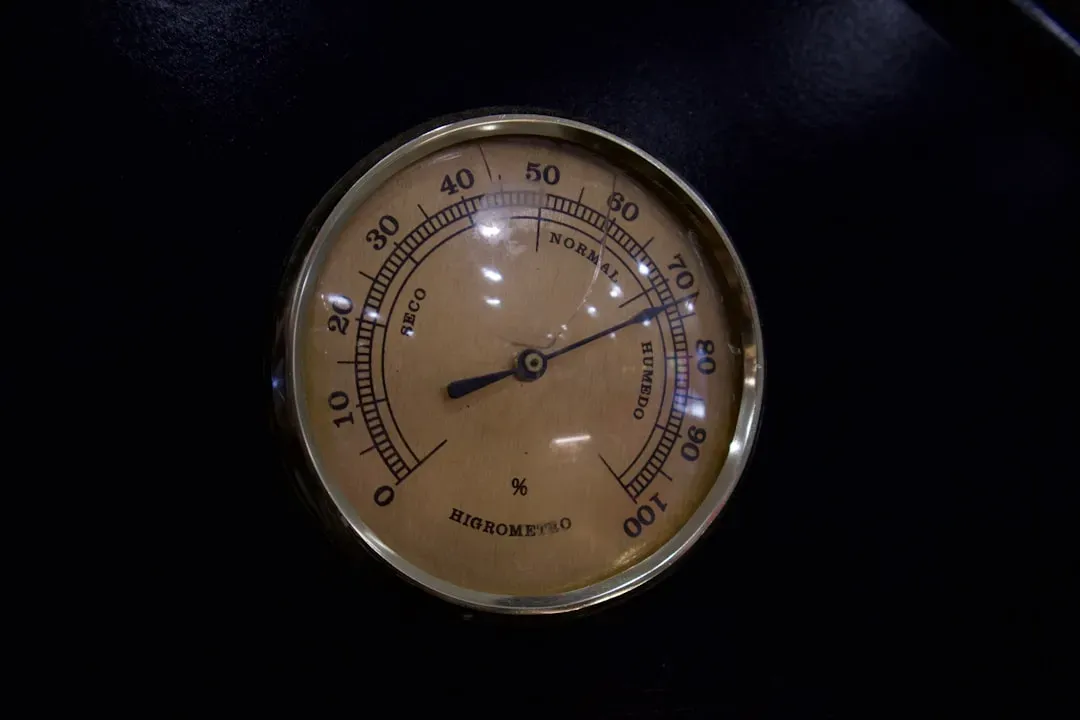
Rain doesn’t appear out of nowhere; it condenses out of air that’s already loading up with moisture. Hygrometers – devices built specifically to measure relative humidity – consistently show a rise in moisture content in the hours leading up to precipitation, especially as warm, wet air masses shove in ahead of a frontal system.
A jump in relative humidity above 70-80% combined with falling pressure is one of the most dependable rain signals instruments can produce. This isn’t just “muggy air” – it’s the atmosphere physically filling with water vapor that eventually has nowhere left to go but down.
Fast Facts
- Fair-weather relative humidity typically hovers around 40-60% in temperate climates.
- A reading above 70-80% paired with dropping pressure is a strong combined rain signal, not humidity alone.
- High humidity without a pressure drop can just mean muggy, rain-free air – common in coastal or desert regions.
- Modern capacitive hygrometers can update readings every few seconds, showing a trend line instead of a single snapshot.
Modern capacitive hygrometers, now built into everything from home weather stations to smartphone sensors, can track this shift in near real-time. Interestingly, humidity alone isn’t a guarantee of rain – deserts sometimes have humid nights with zero rainfall.
It’s the combination of rising humidity with other measurable shifts, like dropping pressure or converging dew point, that meteorologists treat as a real signal rather than noise. This layered approach is why professional forecasts rely on dozens of instruments feeding data simultaneously rather than trusting any single reading in isolation.
#3 – Dew Point and Air Temperature Start Converging

Here’s a stat that surprises most non-meteorologists: when the dew point and the actual air temperature move close together, rain becomes far more likely, because the air is nearly saturated and can’t hold much more moisture without condensing. Thermometers and dew point sensors track this gap constantly, and forecasters watch it like a countdown clock.
A wide gap between dew point and temperature usually means dry air. But as that gap narrows to just a couple of degrees, relative humidity effectively nears 100%, and moisture starts condensing into visible cloud droplets or fog.
This is precisely why early morning fog often burns off into afternoon showers – the numbers were already trending toward saturation overnight. Weather apps rarely explain why this metric matters, but professional forecasters treat dew point convergence as more reliable than humidity percentage alone.
Humidity can spike from temperature swings without any real moisture increase. Dew point, on the other hand, reflects actual water vapor content in the air – a purer signal of what’s genuinely happening chemically, not just thermally.
#4 – Wind Direction and Speed Shift Ahead of the System

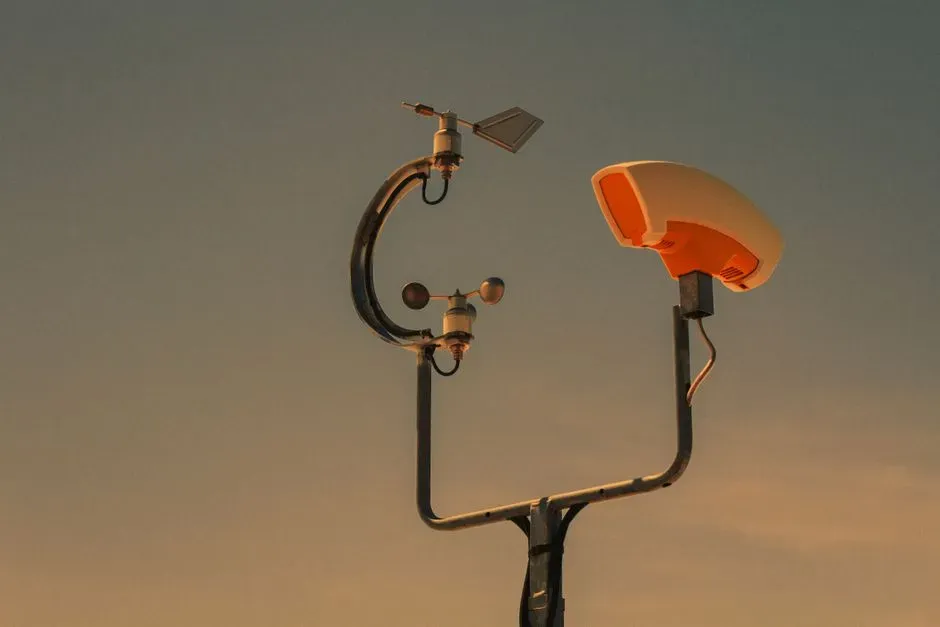
Anemometers and wind vanes – some of the oldest weather instruments in existence – reliably detect shifting wind patterns before a storm arrives, because incoming low-pressure systems physically redirect airflow as they approach. Winds often swing from a steady direction to a more erratic, gusty pattern.
In many regions, a shift from southerly to easterly or northeasterly winds is a textbook pre-rain signal. A sudden gust front – cool, fast-moving air rushing ahead of a storm – can be detected by anemometers minutes before rain hits, sometimes with wind speeds jumping 10-20 mph in moments.
Quick Compare
- Calm pre-storm wind: steady direction, roughly 5-10 mph, easy to ignore.
- Gust front wind: erratic, sudden direction shift, speeds jumping 10-20+ mph in moments.
- Post-frontal wind: steadier again, noticeably cooler, arriving from a new direction after the system passes.
This is the atmosphere’s version of a starting gun, and it’s why outdoor events sometimes clear out fast even when the sky still looks blue. Modern ultrasonic anemometers – no moving parts, just sound-wave sensors – can detect these micro-shifts with incredible precision, tracking speed and direction changes down to the second.
Aviation meteorologists rely heavily on this data because sudden wind shear near airports is both a rain predictor and a safety hazard, making this one of the most operationally critical instruments on this entire list.
#5 – Temperature Drops (or Oddly Spikes) Just Before Onset
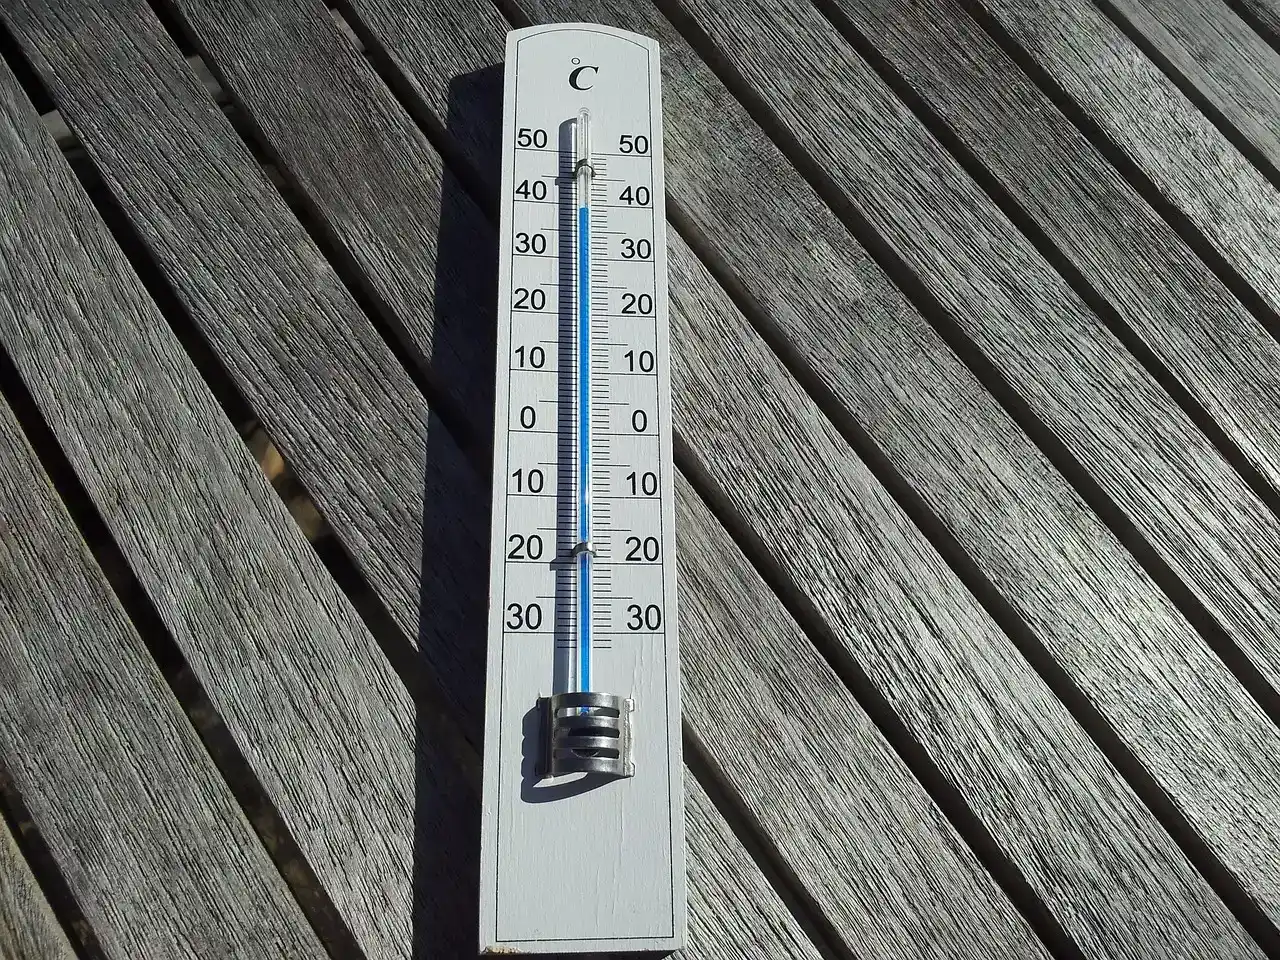
Temperature behaves in two very different but equally telling ways before rain, and thermometers catch both. In many storm systems, temperatures drop several degrees as cooler air is pulled in ahead of the rain.
But in some convective storms, there’s actually a brief warm spike first, as sinking air ahead of the storm compresses and heats up – only to crash once the rain-cooled downdraft arrives. This “warm before the crash” pattern confuses a lot of people who assume rain always means cooling first.
Digital thermometers and temperature loggers used in weather stations track this rapid rise-then-fall pattern in real time. It’s a key reason why storm-chasers and researchers use temperature data alongside pressure and wind readings rather than in isolation.
The temperature swing itself isn’t just cosmetic – it drives the physics of the storm. Rapid cooling after rain begins is caused by evaporative cooling as raindrops fall through drier air below cloud base, a process meteorologists call “virga cooling.” It’s measurable, dramatic, and one of the more visually satisfying data points on any weather station’s temperature graph.
#6 – Atmospheric Electric Field Readings Spike Before You See a Single Bolt
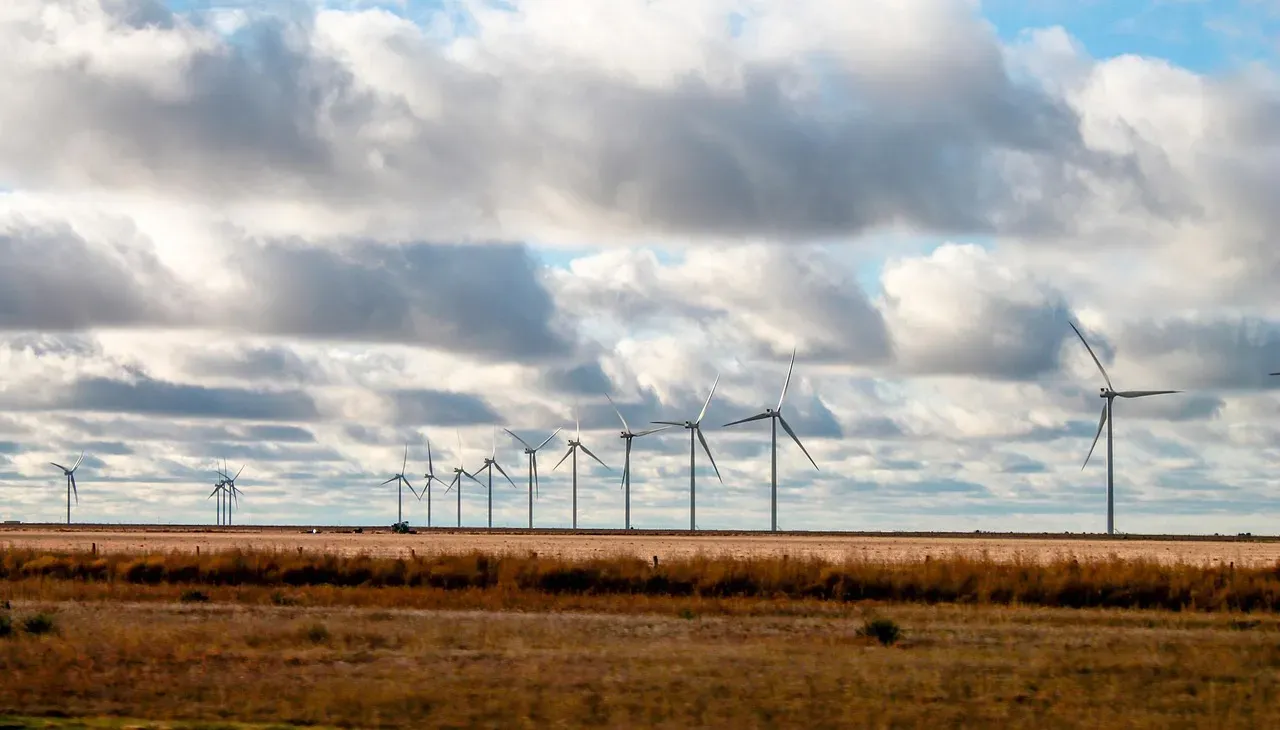
Long before lightning is visible, the atmosphere’s electrical charge starts shifting, and specialized instruments called electric field mills are built specifically to catch it. These devices measure the strength of the electric field near the ground, and readings can spike dramatically as charge separation builds inside developing storm clouds.
Airports and space launch facilities use electric field mills as mandatory safety instruments, because a rapid change in electric field readings can indicate imminent lightning risk – even minutes before a storm visibly arrives overhead.
This is why rocket launches get scrubbed on days that don’t even look stormy; the sky’s electrical mood is already shifting even when the clouds look harmless. This field data is treated as more urgent than radar in short-term lightning forecasting, since it can detect charge buildup happening directly overhead rather than relying on distant precipitation signatures.
It’s one of the more dramatic, underappreciated instruments in this list – less famous than radar, but arguably more life-saving in specific high-risk industries.
#7 – Radar Detects Rain That Hasn’t Even Reached the Ground Yet
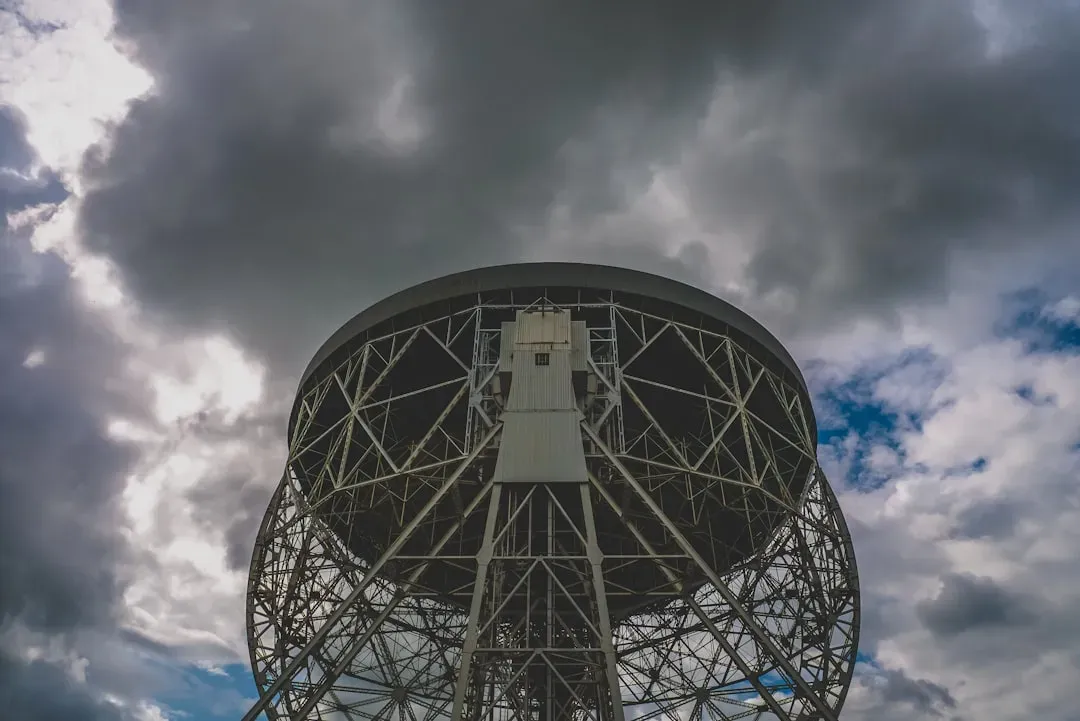
Doppler radar doesn’t just show rain – it shows rain that’s still falling through the sky, sometimes evaporating before it ever reaches you. This phenomenon, known as virga, is one of the most fascinating things radar reveals: precipitation clearly visible on a radar screen, while the ground below stays completely dry.
Meteorologists use radar reflectivity data to estimate not just whether it’s raining, but how intensely, and how far above the ground that rain currently sits.
Worth Knowing
- Radar reflectivity is measured in decibels (dBZ) – light rain usually reads around 20-35 dBZ, while heavy rain and thunderstorms often exceed 40-50 dBZ.
- Virga can light up a radar screen in bright colors while the ground below stays completely dry.
- Dual-polarization radar can tell rain apart from hail and snow by analyzing the shape of falling particles, not just intensity.
- A typical U.S. radar site can detect precipitation out to roughly 250 miles, giving useful lead time for approaching systems.
This is why forecasters sometimes say “rain is likely within the hour” even when the sky above your specific location looks totally clear – the radar is catching precipitation columns that haven’t descended yet, moving toward your area on prevailing winds.
Dual-polarization radar, now standard across the U.S. National Weather Service network, goes even further, distinguishing between rain, hail, and snow based on the shape and size of falling particles. This upgrade transformed short-term rain prediction from a rough guess into a genuinely precise measurement of what’s falling, where, and how fast it’s headed toward the surface.
#8 – Infrasound Sensors Pick Up Storms From Hundreds of Miles Away
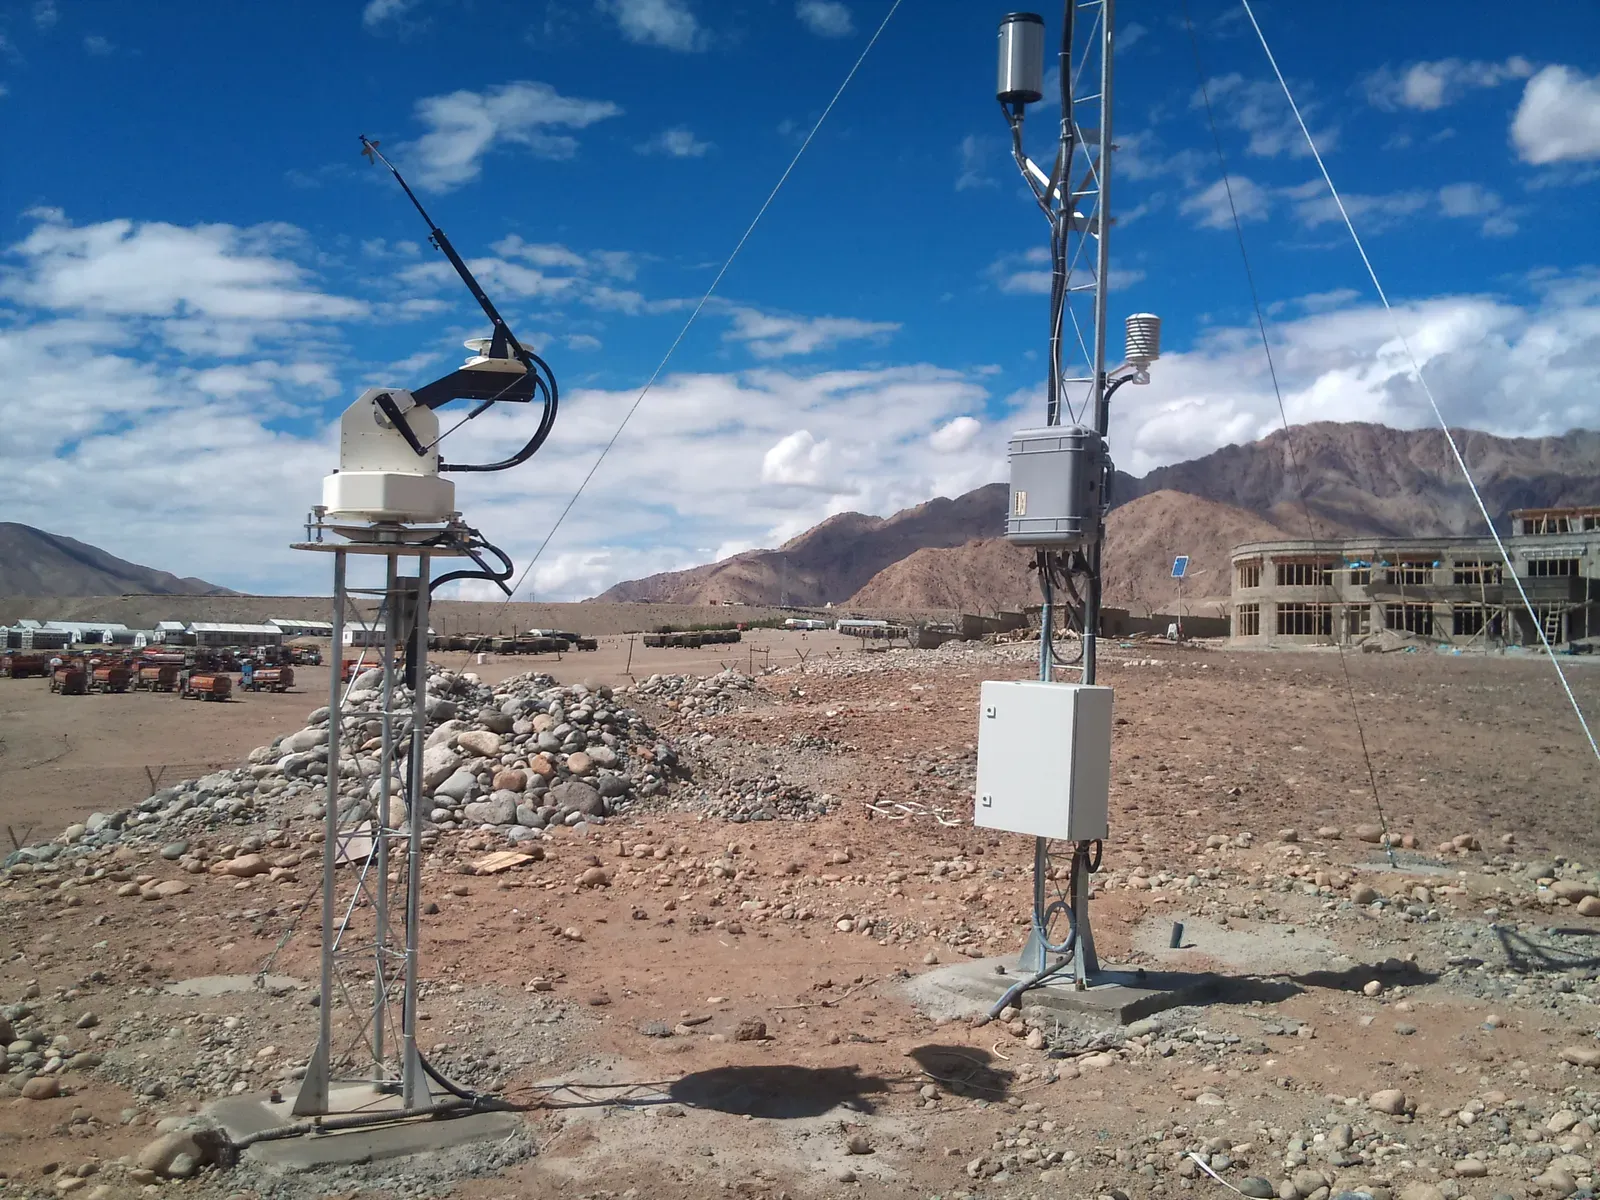
Here’s one most people have never heard of: storms generate infrasound – extremely low-frequency sound waves below the range of human hearing – and specialized microbarometers can detect these waves from storms hundreds of miles away, often well before local instruments show any change.
Some infrasound research has shown detectable signals from severe storm systems more than 100 miles from the sensor, arriving hours ahead of the storm’s actual arrival.
This isn’t science fiction – it’s an active area of atmospheric research, with networks of infrasound stations originally built for monitoring nuclear test explosions now repurposed to study severe weather patterns.
While this technology isn’t yet standard in consumer weather stations, it represents one of the most futuristic tools in a forecaster’s kit. Tornado and severe storm researchers are particularly interested in infrasound signatures because certain frequencies appear to correlate with tornado formation specifically, potentially offering warning times that outperform even the best radar-based tornado alerts available today.
#9 – Ozone Levels Spike Near a Storm That’s Still Building
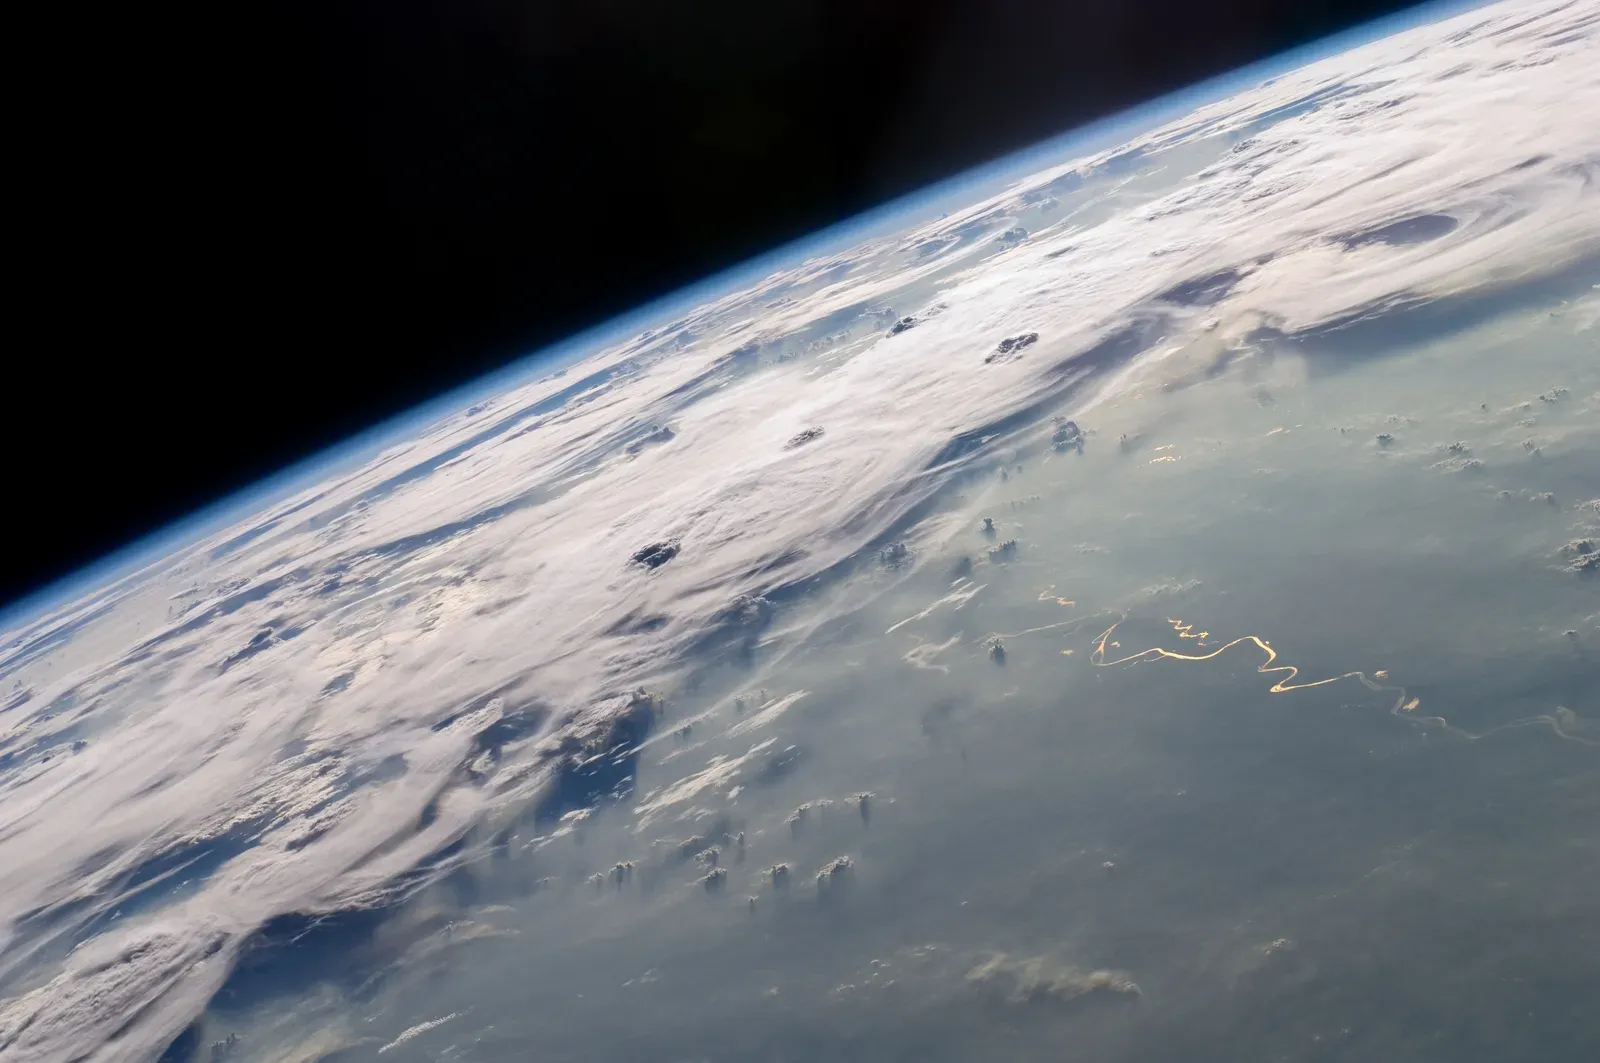
Ozone sensors – typically used for air quality monitoring – also pick up a strange but well-documented pattern before thunderstorms: ozone concentrations near the surface can spike as electrical activity increases in developing storm clouds. Lightning discharges, and the strong electric fields that precede them, can produce localized ozone even before the first bolt is visible.
This is part of what creates that sharp, almost metallic smell some people associate with an approaching storm – though the more famous “rain smell” actually comes from a different compound entirely (more on that next).
Researchers studying storm chemistry use ozone monitors alongside electric field mills to build a fuller picture of how electrified a developing storm cell has become. This measurable ozone spike is strongest closest to areas with active lightning.
That means ozone sensors near storm-prone regions can sometimes offer indirect confirmation that a storm cell overhead is intensifying, not just producing rain but actively building toward a lightning-heavy phase.
#10 – The Smell of Rain Builds Up in the Air Before It Ever Falls
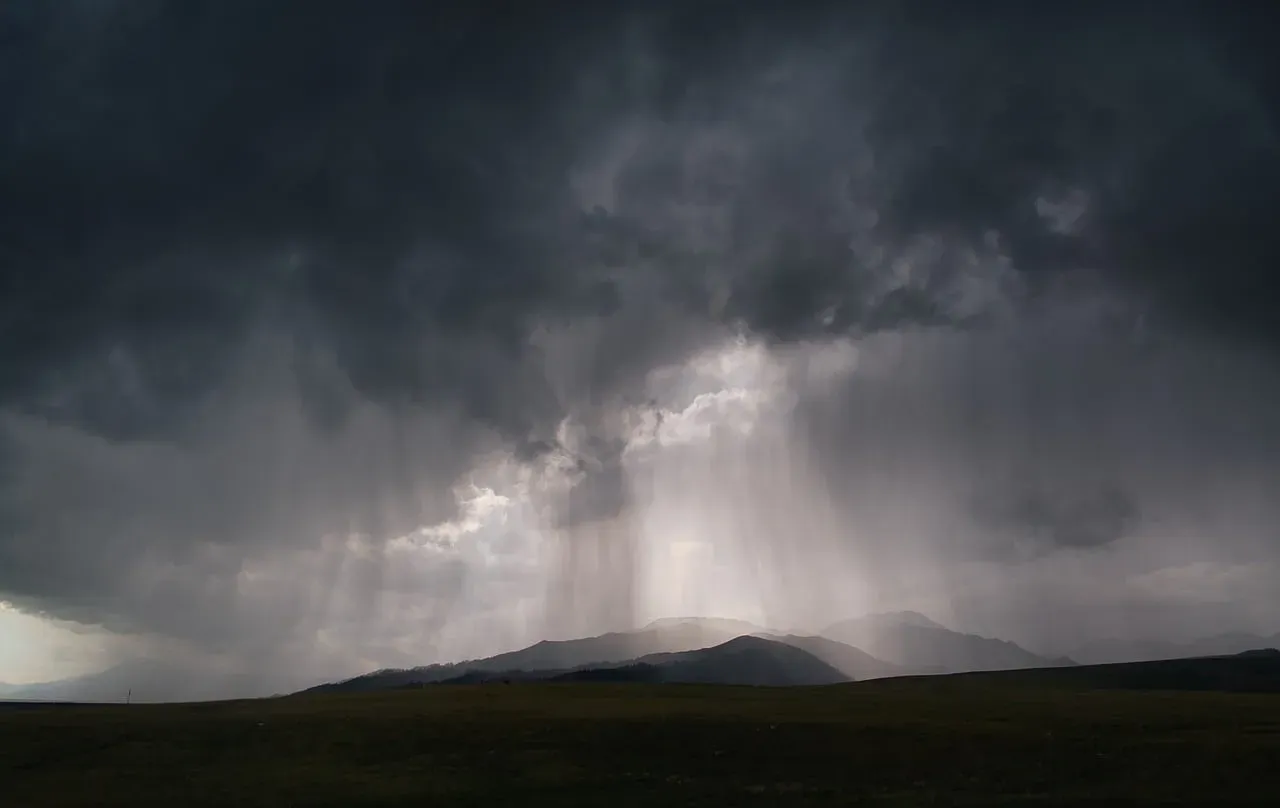
That unmistakable “smell of rain” has an actual scientific name and a measurable chemical cause: geosmin, a compound produced by soil-dwelling bacteria, gets released into the air as raindrops hit dry ground. But detectable trace amounts can build up in humid pre-storm air even before rain physically starts.
Human noses are extraordinarily sensitive to geosmin – some studies suggest people can detect it at concentrations as low as a few parts per trillion, making it one of the most detectable compounds to the human nose of any known chemical.
The smell after rain, known as petrichor, is caused by a chemical compound that plants produce during dry periods.
United States Geological Survey
Electronic “nose” sensors and gas chromatography equipment used in atmospheric chemistry labs can quantify this buildup precisely, confirming what humans have sensed instinctively for generations. This is a case where instruments are catching up to human biology rather than surpassing it – the human nose has effectively been a rain-predicting instrument all along, science just recently learned how to explain it in molecular detail.
#11 – Cloud Base Height Drops Measurably as the Sky Closes In
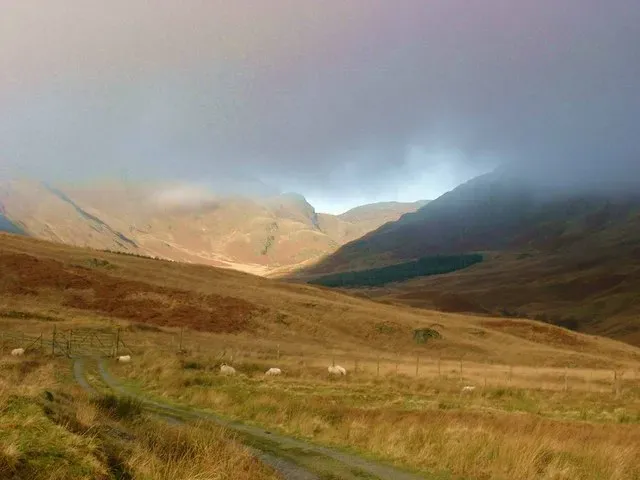
Ceilometers – laser-based instruments that measure how high cloud bases sit above the ground – consistently show cloud bases lowering as a storm system approaches, often well before rain becomes visible from the ground. This drop happens because rising humidity allows condensation to occur at lower altitudes, pulling the visible cloud deck closer to the surface.
Airports rely heavily on ceilometer data because a rapidly lowering cloud base is one of the clearest pre-rain (and pre-fog) signals available, directly affecting flight safety and landing visibility minimums.
At a Glance
- Aviation forecasters sort cloud ceilings into flight categories: VFR (above 3,000 feet), MVFR (1,000-3,000 feet), IFR (500-1,000 feet), and LIFR (below 500 feet).
- A ceiling dropping from thousands of feet to under 1,000 feet within an hour often signals fast-deteriorating weather.
- Laser-based ceilometers can refresh cloud height readings every few seconds – far faster than a human eye estimate.
- Fog and low stratus can mimic a pre-rain ceiling drop, which is why ceilometer data gets paired with humidity and dew point readings.
A cloud base that’s dropped from several thousand feet to just a few hundred feet in a short window is a strong operational signal that conditions are deteriorating fast.
Modern ceilometers use laser pulses – a technology closely related to lidar – to measure cloud height with remarkable precision, updating readings every few seconds. This makes them one of the most responsive instruments on this list, capable of showing measurable change in near real-time as moisture-laden air pushes cloud decks lower toward the ground.
#12 – Invisible Particles in the Air Start Behaving Differently
Clouds and rain don’t form in a vacuum – they need tiny particles called condensation nuclei (dust, pollution, sea salt, pollen) for water vapor to condense onto. Particle counters and nephelometers, instruments that measure aerosol concentration and activity, show measurable shifts in particle behavior as humidity rises and these particles begin absorbing moisture ahead of cloud formation.
Some atmospheric research has shown that changes in aerosol concentration can influence not just whether clouds form, but how efficiently they produce rain, making aerosol monitoring a genuine, if underappreciated, rain-prediction tool.
This is a newer, more specialized area of forecasting compared to pressure or humidity tracking, but it’s increasingly used in climate and precipitation research.
Urban areas with heavier pollution sometimes show altered rainfall patterns specifically because of aerosol overload, a phenomenon researchers continue to study closely. It’s a reminder that rain isn’t purely a “natural” process anymore in many regions – human-generated particles are now measurably woven into how, when, and how efficiently storms actually produce precipitation.
#13 – GPS and Radio Signals Get Measurably Delayed by Rising Moisture
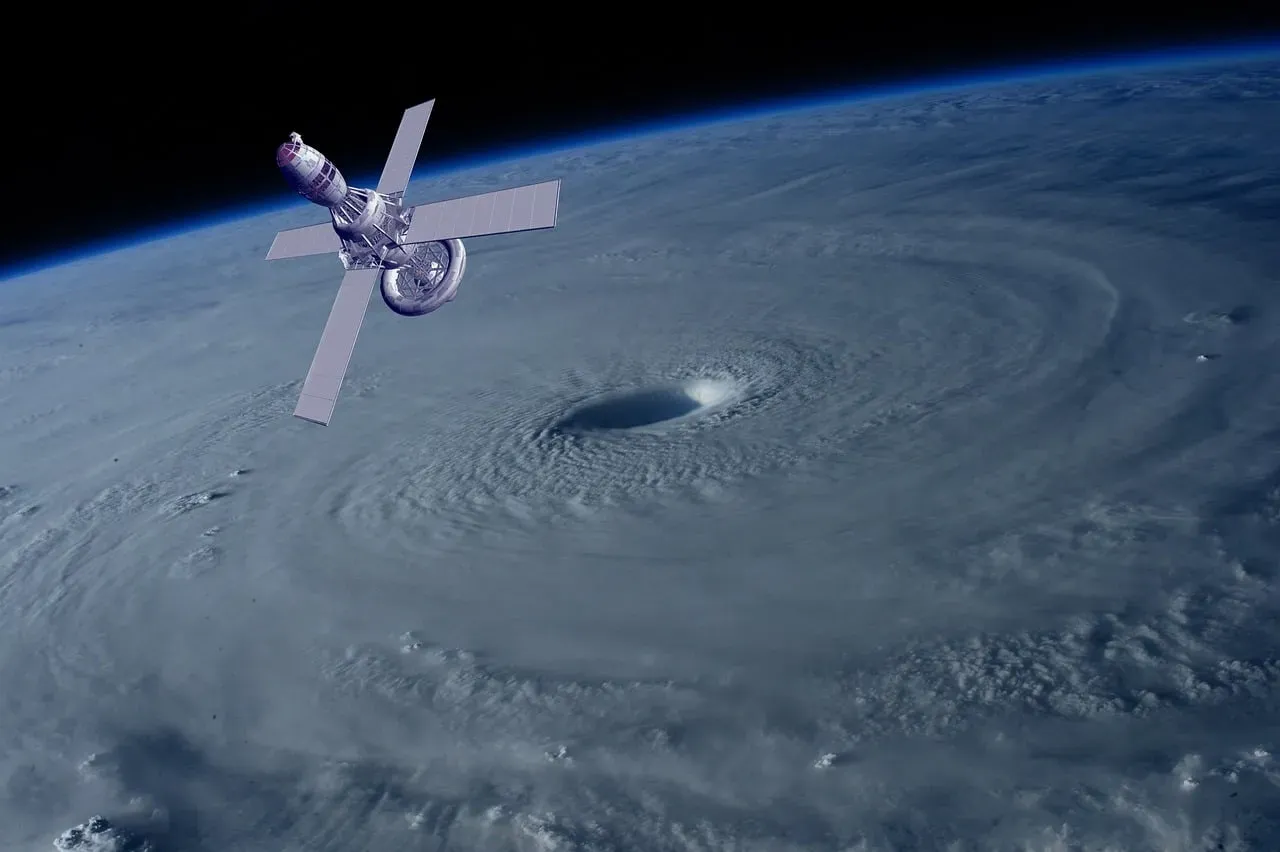
This one sounds almost like a glitch, but it’s real, well-documented atmospheric science: as water vapor increases in the atmosphere ahead of rain, it slightly slows down GPS and radio signals passing through it, and this delay is precise enough to be measured and used for forecasting.
Meteorologists have developed a technique called GPS meteorology specifically because rising atmospheric water vapor causes a measurable delay in GPS signal timing, allowing scientists to estimate moisture content across huge areas using existing satellite infrastructure.
This turns thousands of GPS ground stations, originally built for navigation, into an accidental nationwide network of humidity sensors.
This method has become increasingly valuable because it fills gaps left by traditional weather balloons, which only provide moisture readings at limited times and locations. GPS meteorology instead offers continuous, real-time atmospheric moisture tracking, making it one of the most quietly revolutionary tools in modern forecasting – hiding in plain sight inside a technology most people only associate with driving directions.
The Bottom Line
Rain never actually “just happens.” Pressure falls, humidity climbs, wind shifts, electric fields spike, and even GPS signals slow down – all before a single drop hits the ground. The most surprising takeaway isn’t any single instrument, but how many independent systems – barometers, radar, electric field mills, even satellite navigation – are quietly confirming the same story from wildly different angles.
If there’s one myth worth killing, it’s the idea that forecasting is guesswork. It’s closer to detective work, built on dozens of overlapping physical clues most people never think about.
The atmosphere is talking constantly; we’ve just built better ways to listen. Which of these signs did you already notice yourself, without ever owning a single instrument? Drop it in the comments.