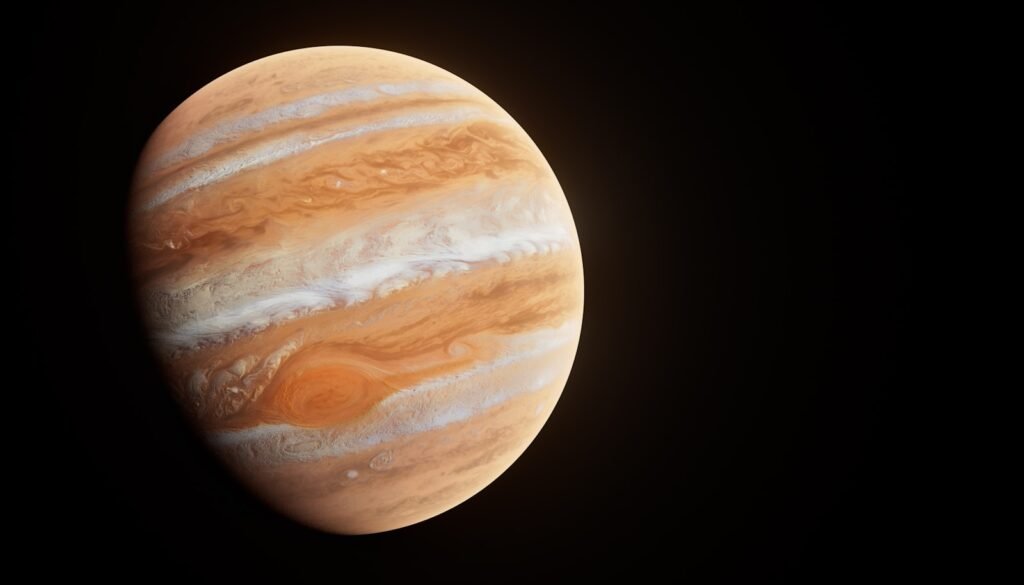
Through a telescope, Jupiter looks eternal – a striped giant with a brick-red eye that never seems to blink. But the reality is messier and far more exciting: the , shifting, and speeding up at the edges, and every new data set seems to complicate the plot. For planetary scientists, this isn’t a sad farewell; it’s a once-in-a-generation laboratory for watching a colossal storm evolve in real time. As fresh Hubble images and Juno flybys stack up, the storm’s changing size, depth, and color are forcing us to rethink how giant-planet atmospheres actually work. That tension – between a fading icon and a rising wave of insight – is the story worth following now.
The Hidden Clues
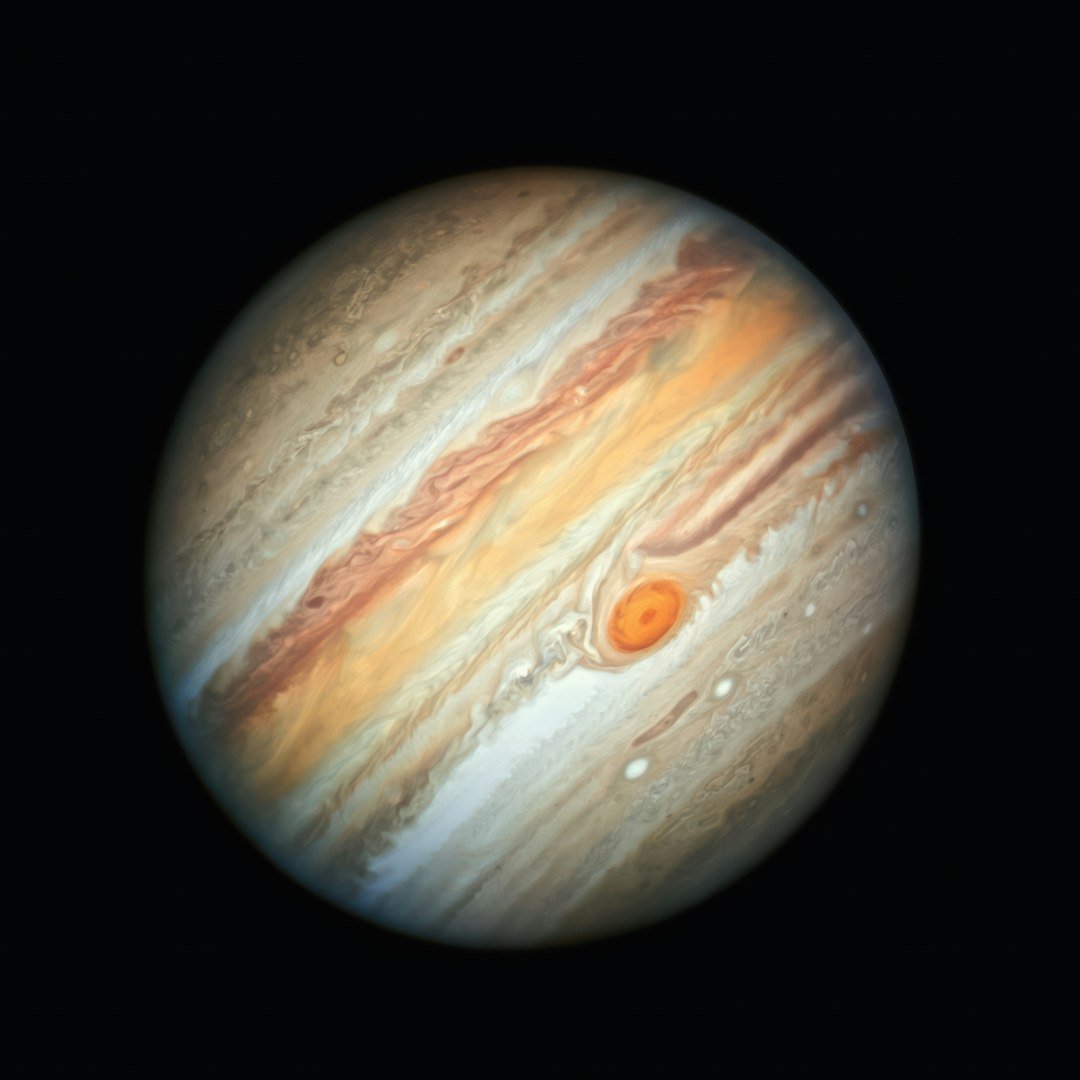
Here’s the gut-punch: the Red Spot we sketch in our notebooks today is much smaller than the one astronomers logged a century ago, and yet its outer winds have subtly quickened over the past decade. That paradox is the hook, because a storm that tightens and spins faster at the rim is telling us about energy moving in unexpected ways. I still remember the first time I saw it in a backyard telescope – the spot looked calm, but the data say it’s anything but calm. Shifts like these are the fingerprints of deep physics, not a mere cosmetic makeover. They hint at a machine working beneath the clouds that we’re only starting to map.
Annual Hubble monitoring now shows those rim winds increased by up to 8% over 2009–2020, even as the spot’s footprint continued its long retreat. That duo of signals – shrinkage in size, acceleration in the outer “racetrack” – sets up the central mystery scientists are tackling in 2025.
From Ancient Sketches to Spacecraft Eyes

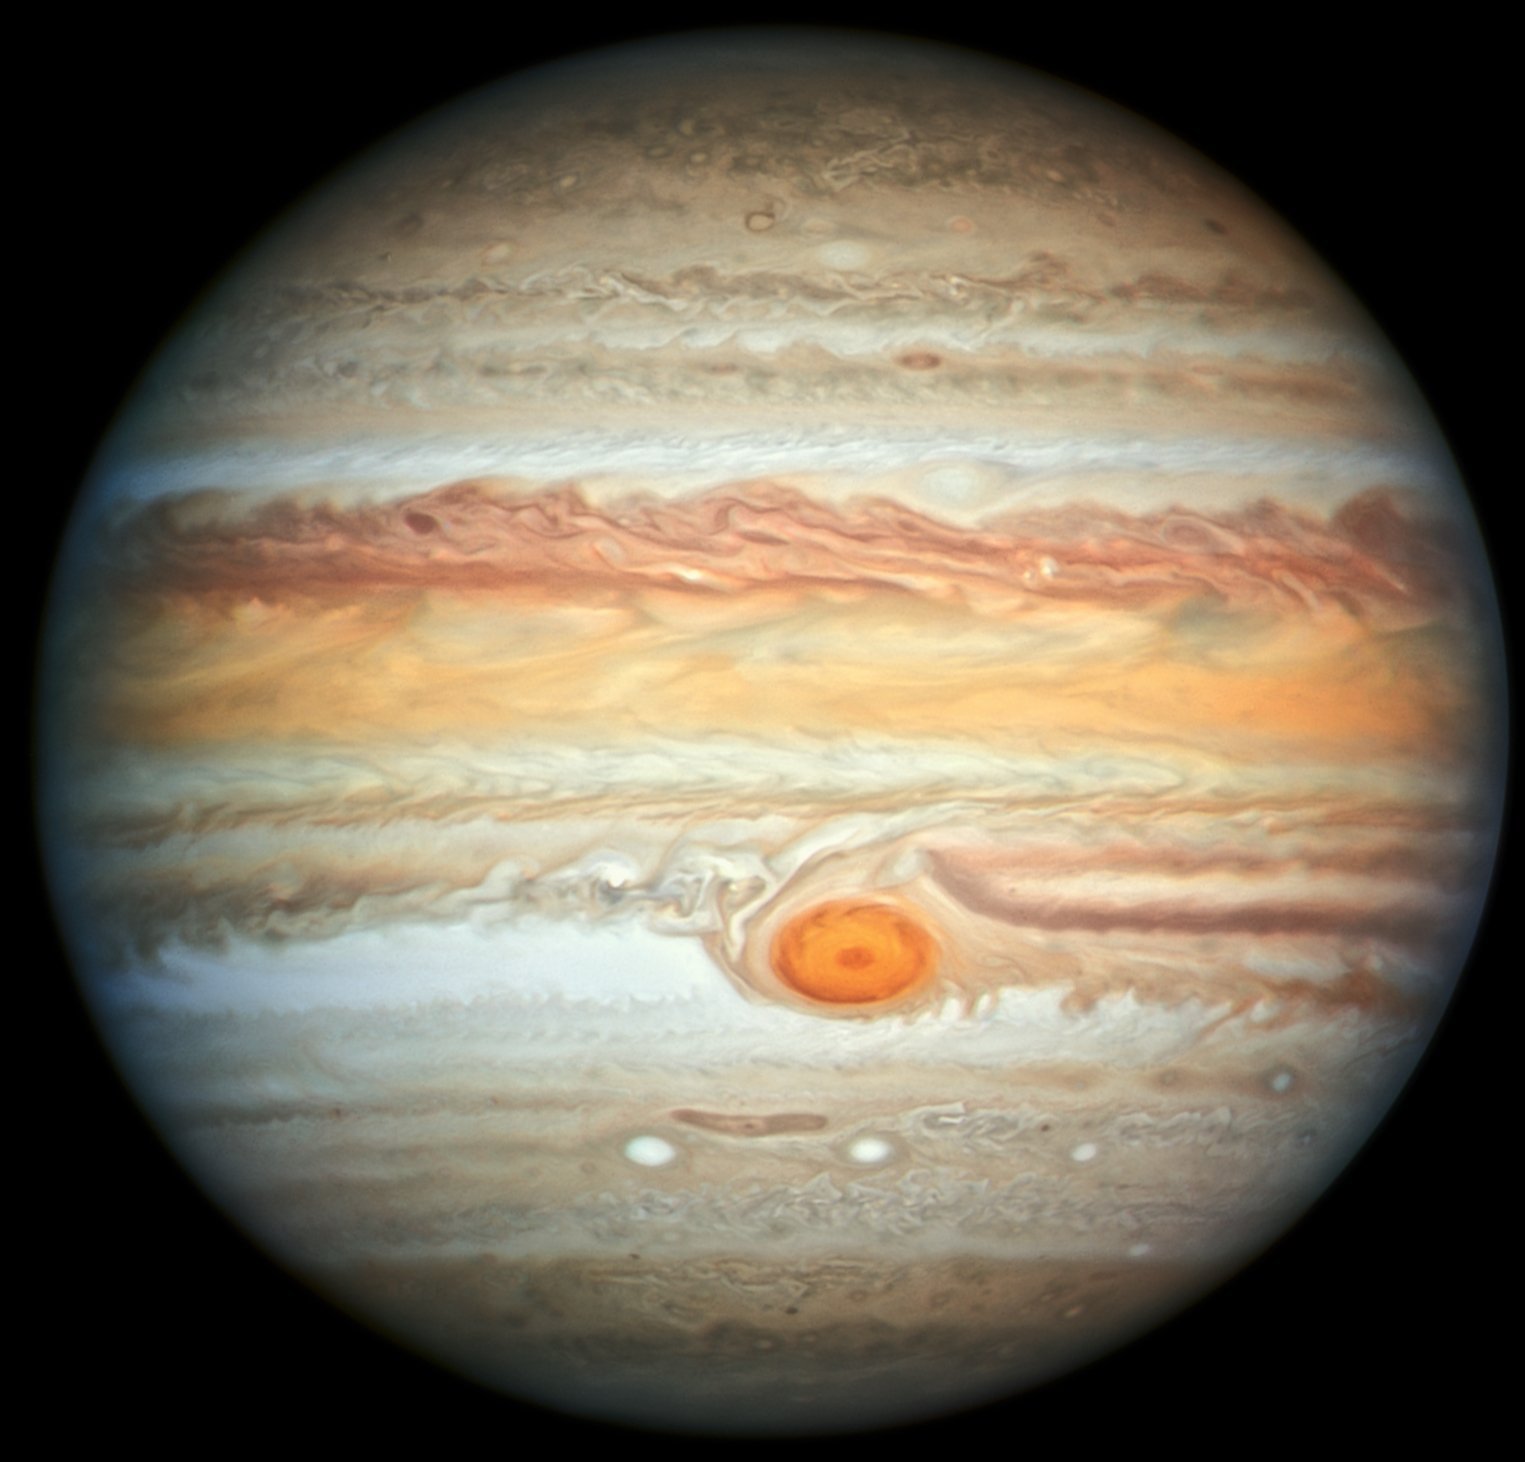
Historically, the Great Red Spot stretched wide enough to swallow nearly three Earths; late nineteenth-century measurements put its long axis near forty thousand kilometers. Voyager’s 1979 snapshots already showed a notably smaller oval, and by the mid-1990s Hubble was clocking it at close to half that historic width. Around 2012, amateur observers began reporting a new pace of shrinkage, as if the storm were cinching its belt year by year. By 2014, Hubble confirmed the smallest diameter ever recorded – roughly Earth-and-a-third across. That’s still gigantic, but it’s a far cry from the Victorian-era behemoth.
Even the weird “peel-off” episodes of 2019, when reddish streamers flaked away from the spot’s edge, turned out not to be doom but drama. Follow-up analyses showed those were high-altitude hazes advected by winds, a cosmetic shedding rather than the core vortex falling apart. It was a good reminder that cloud color doesn’t always track the invisible, muscular flow fields, and that careful velocity mapping beats eyeballing every time.
What the Numbers Say
Data points matter when the storm itself refuses to sit still. Here are a few load-bearing ones from the past decade-plus of monitoring and flybys:
– The spot’s diameter, once measured near twenty-five thousand miles in the late 1800s, was reported near ten thousand miles in 2014, after a period when the shrinkage briefly accelerated. – Hubble analyses found the outer high-speed ring sped up by up to 8% between 2009 and 2020, with some winds surpassing four hundred miles per hour.
Inside the Storm: Depth, Speed, and Color
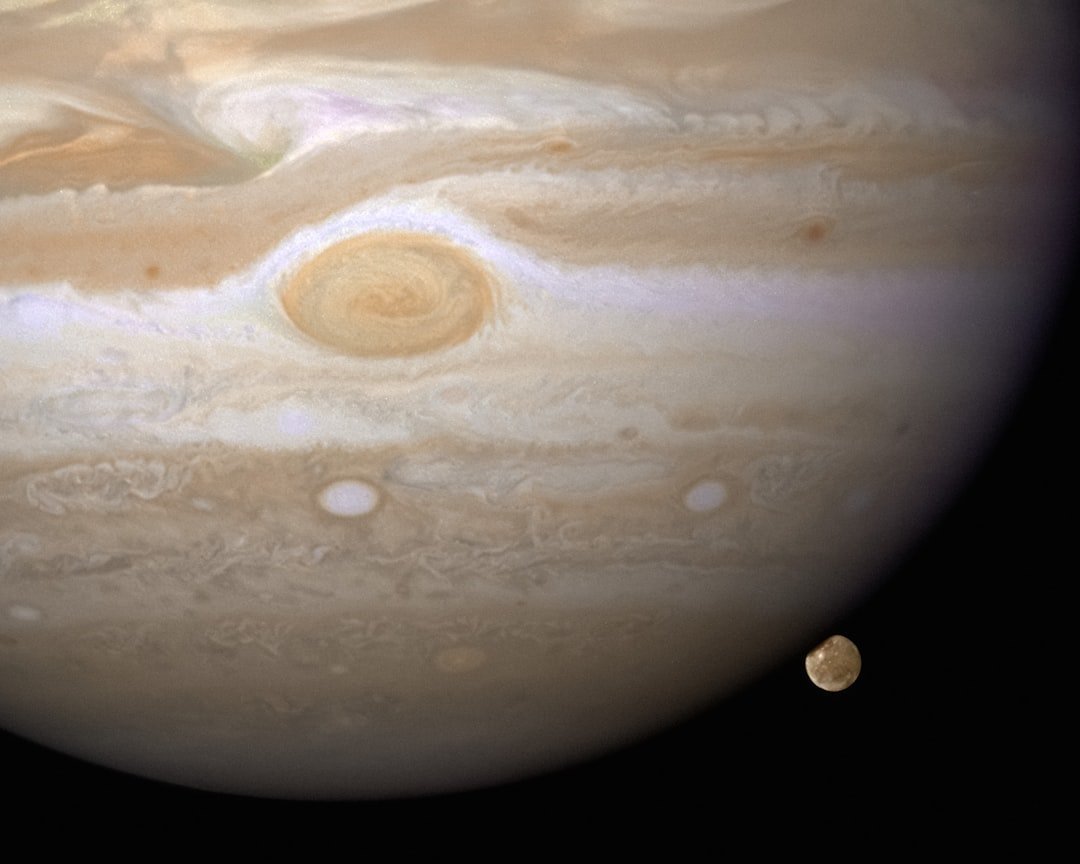
Juno’s microwave and gravity science cracked a question no telescope could: how deep are the roots. The answer is startling – several hundred kilometers – meaning the Red Spot isn’t a paper-thin swirl but a stubby, deeply anchored vortex sunk well below the topmost clouds. That’s deeper than the familiar cloud-forming weather layer, but still shallower than the planet-wide jets that may help steer and feed it. Depth like that makes persistence easier to understand even as the visible cap shrinks.
Color adds another twist. Lab work and spacecraft spectra point to photochemical “sunburn” at high altitude – simple compounds broken by ultraviolet light, painting the storm’s crown a rusty red while much of the structure beneath remains comparatively pale. That means changing hues can reflect chemistry and lighting as much as dynamics, and it helps explain why the spot sometimes looks redder or taller without implying a major structural shift.
Why It Matters
Giant-planet storms aren’t just pretty; they’re physics engines that test our models of rotating, stratified fluids at scales Earth can’t match. By tracking how the Red Spot tightens, spins, and breathes with depth, researchers confront core questions about energy sources, turbulence, and how jets exchange momentum with long-lived vortices. Against that backdrop, Hubble’s rim-wind uptick and Juno’s deep roots become more than trivia; they’re constraints any serious model must satisfy. That’s how a oval becomes a benchmark for atmospheric theory.
And the lessons travel. Exoplanet atmospheres are dominated by fast rotation and fierce irradiation, which means the tricks we learn at Jupiter – how hazes redden, how jets couple to deep flows, how storms resist shear – feed directly into the next generation of climate interpretations for worlds we’ll never touch. Understanding one famous storm sharpens our tools for thousands of alien skies.
Global Perspectives
This has become a truly planetary project: space telescopes, a polar-orbiting probe, and an army of night-owl amateurs stitching together a continuous weather log. When the 2019 flaking began, it was observers from Australia to the Philippines to Europe who first flagged the anomaly, letting teams queue Hubble and coordinate Juno’s context imaging. That real-time pipeline now exists every apparition, making Jupiter one of the best-surveilled worlds beyond Earth. As someone who still lugs a small Dobsonian into the backyard, I love that a crisp night in a quiet cul-de-sac can feed world-class science. It’s the rare case where global crowdsourcing genuinely moves the needle.
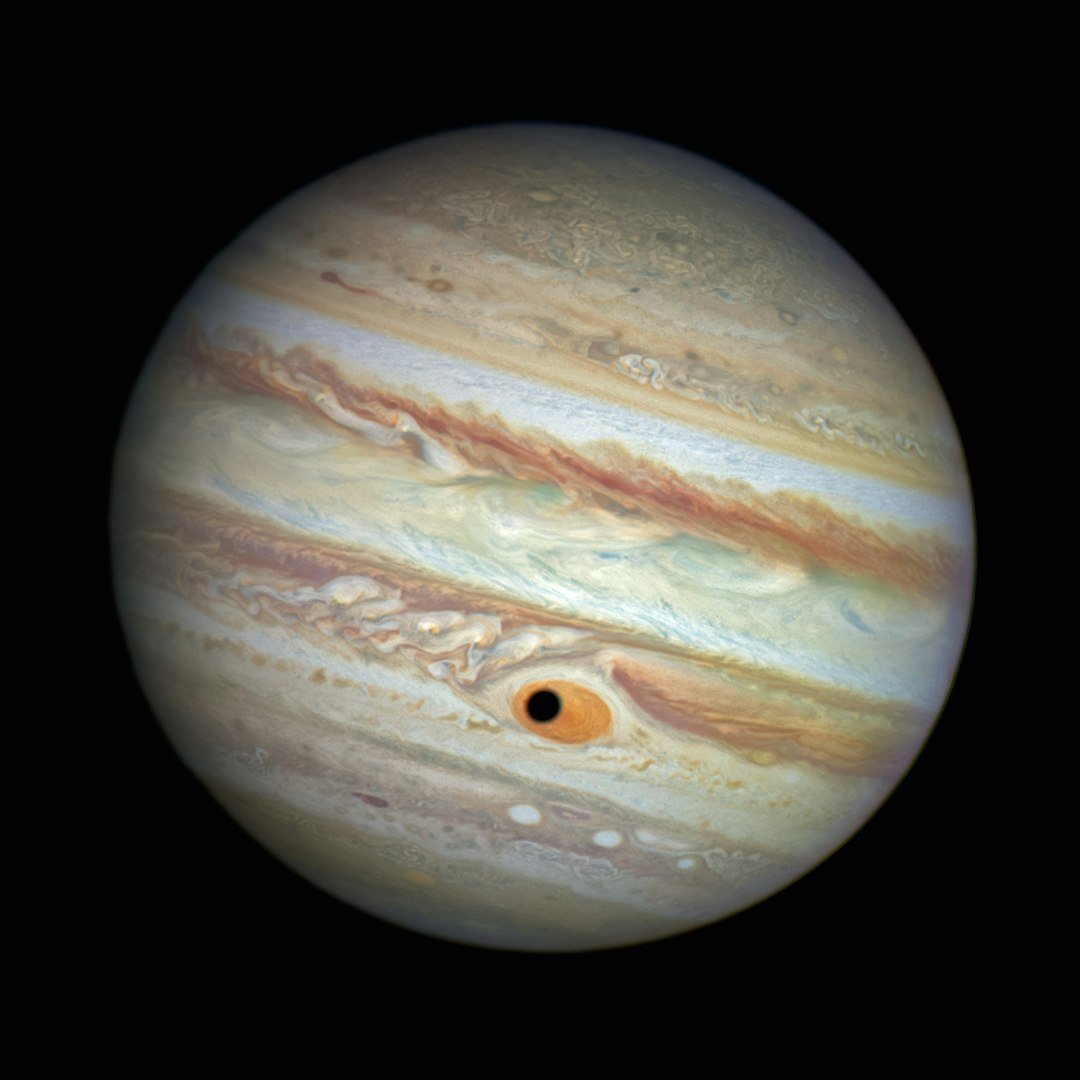
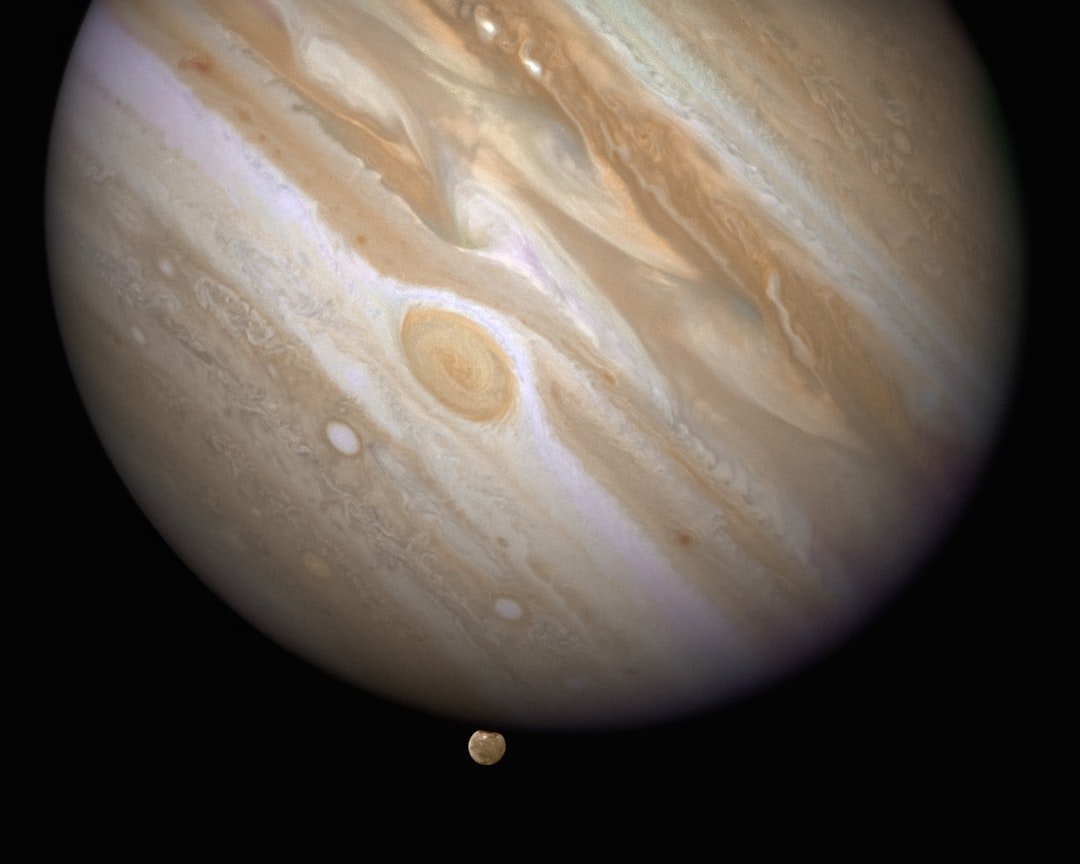
Meanwhile, Hubble’s OPAL program produces annual, apples-to-apples portraits of the entire disk, acting like a planetary MRI that catches slow drifts and quick outbursts alike. In January 2024, OPAL’s multiwavelength views again pinned the Red Spot and its neighbors, showing how fresh plumes, polar hazes, and companion anticyclones modulate the scene from month to month. Those consistent snapshots keep the long record honest.
The Future Landscape
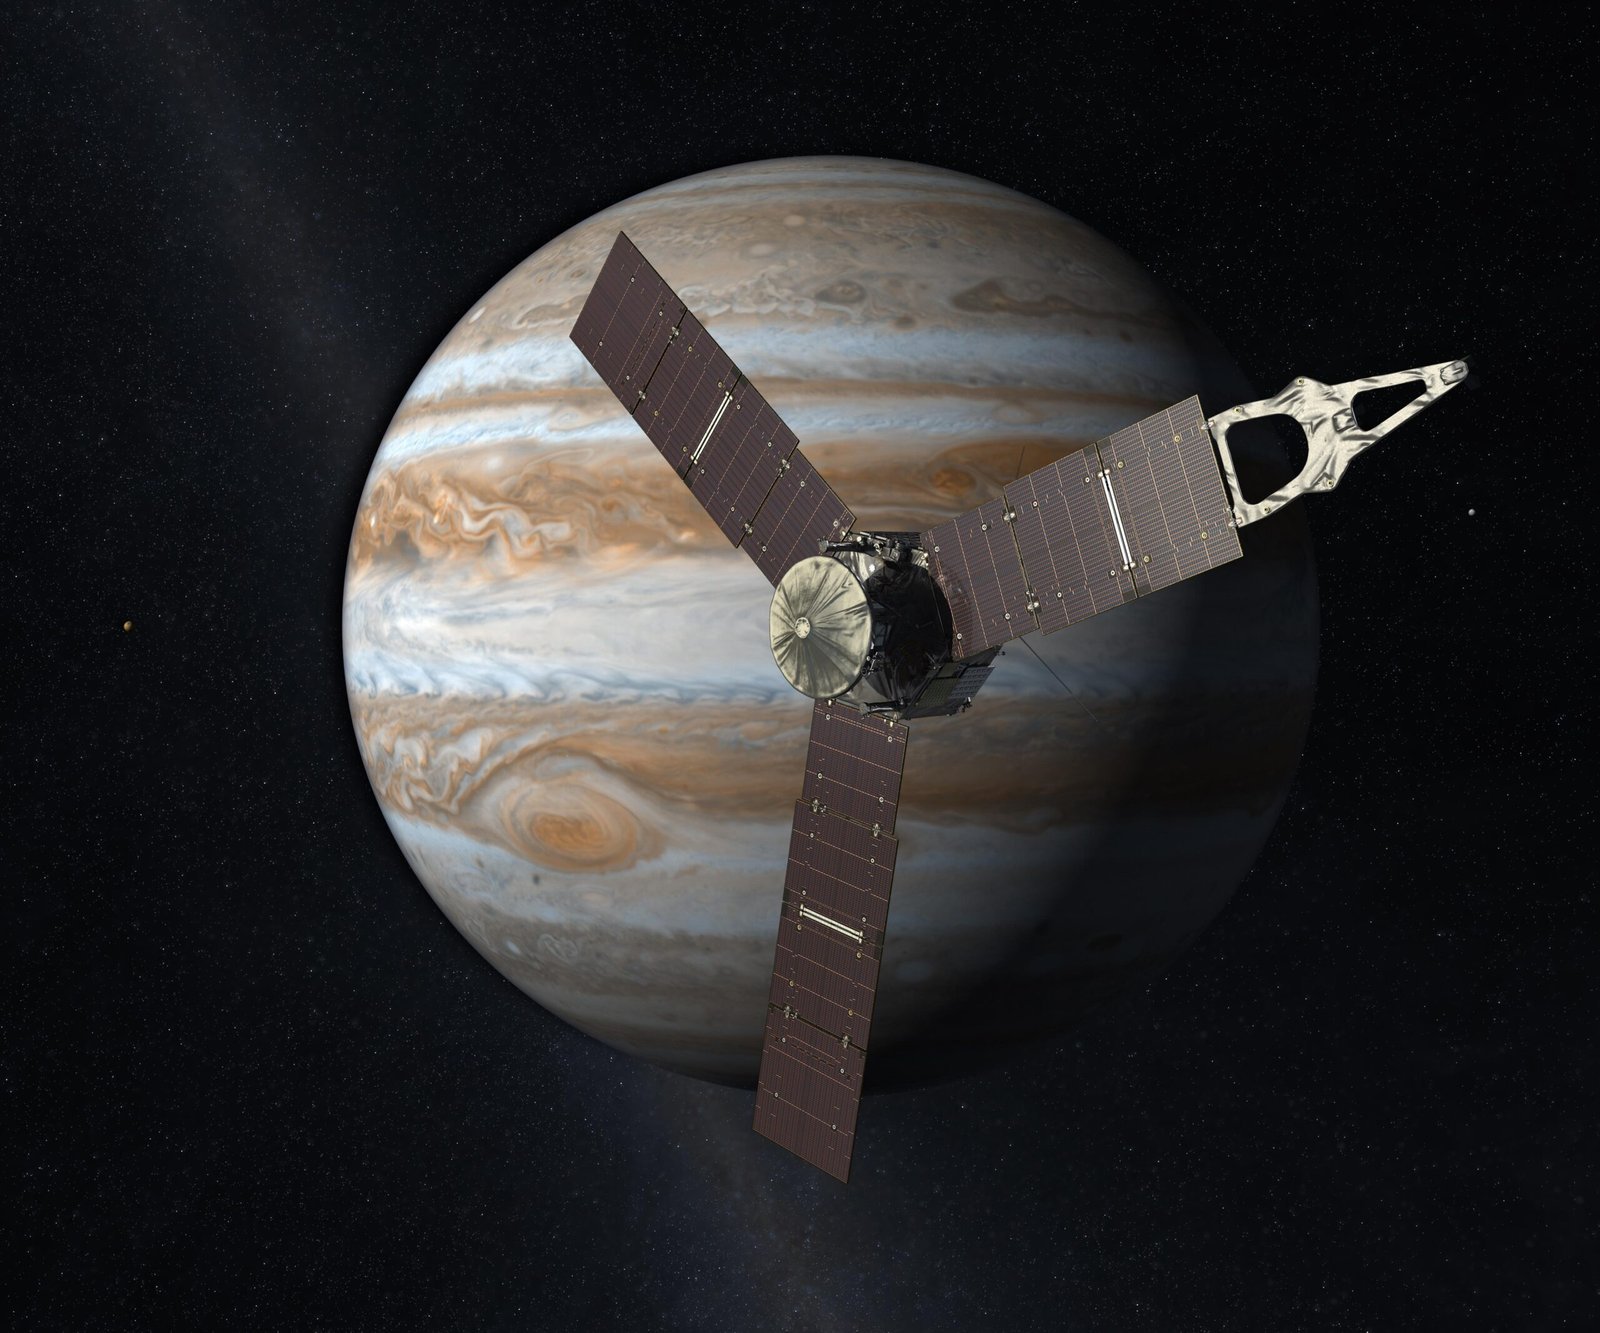
Short-term, the story still runs through Juno, which NASA has extended through September 2025. Every close pass brings microwave soundings of ammonia, updated gravity fields, and context for how the belts and zones trade places with depth – a transition layer some researchers even nickname the “Jovicline.” As Juno ages, the baton will pass to a broader ecosystem: JWST’s infrared spectroscopy, Hubble’s yearly weather reports, and an onslaught of giant ground-based telescopes sharpening wind maps from the cloud tops down. The result will be a multi-layered storm diary unmatched in planetary science.
Longer-term, ESA’s JUICE and NASA’s Europa Clipper target the Jovian system for other reasons, but their instruments and coordinated campaigns will keep tabs on the planet’s climate context. If the Red Spot continues to contract, we’ll see whether its winds intensify further, whether its cloud cap fades, or whether it stabilizes at a new, more compact equilibrium. Either way, the data rate and the diversity of methods are finally equal to the mystery.
How You Can Engage
If you’ve got a modest telescope and a camera, you can contribute images that help professionals time their observations and cross-check wind-tracking algorithms. Even without gear, you can follow Hubble’s OPAL releases, browse processed JunoCam images, and support the groups that keep planetary weather archives flowing to the public. Small actions add up: sharing reliable visuals, backing science education, and encouraging students to chase questions that don’t have tidy answers yet. Watching the Red Spot evolve is not a spectator sport anymore; it’s a collaborative chase. Next time Jupiter rises, take a look – you might see history wobbling at ten hours per rotation.

Suhail Ahmed is a passionate digital professional and nature enthusiast with over 8 years of experience in content strategy, SEO, web development, and digital operations. Alongside his freelance journey, Suhail actively contributes to nature and wildlife platforms like Discover Wildlife, where he channels his curiosity for the planet into engaging, educational storytelling.
With a strong background in managing digital ecosystems — from ecommerce stores and WordPress websites to social media and automation — Suhail merges technical precision with creative insight. His content reflects a rare balance: SEO-friendly yet deeply human, data-informed yet emotionally resonant.
Driven by a love for discovery and storytelling, Suhail believes in using digital platforms to amplify causes that matter — especially those protecting Earth’s biodiversity and inspiring sustainable living. Whether he’s managing online projects or crafting wildlife content, his goal remains the same: to inform, inspire, and leave a positive digital footprint.