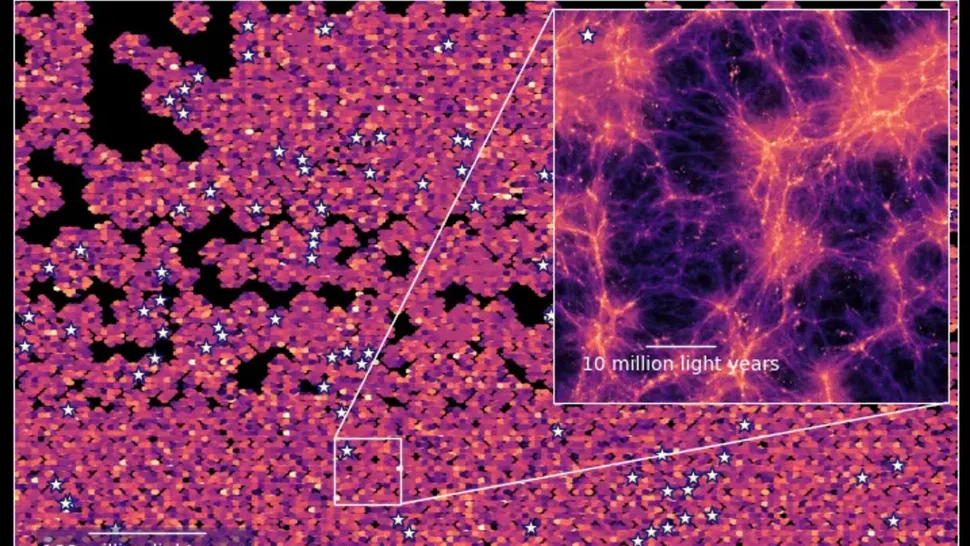
Unexpected Glow Challenges Old Assumptions (Image Credits: HETDEX)
A groundbreaking 3D map has exposed a brilliant glow of hydrogen light filling the spaces between early galaxies, reshaping views of cosmic evolution.[1][2]
Unexpected Glow Challenges Old Assumptions
For decades, astronomers viewed the vast voids between distant galaxies as dark and empty during the universe’s formative years. Researchers shattered that notion with data from the Hobby-Eberly Telescope Dark Energy Experiment, or HETDEX.
The map revealed a pervasive “sea of light” from Lyman-alpha emissions, produced when hydrogen atoms absorbed stellar energy roughly 9 to 11 billion years ago. This glow originated from faint galaxies and intergalactic gas clouds that traditional surveys overlooked.[3]
HETDEX collected over 600 million spectra across a sky patch spanning more than 2,000 full moons, processing half a petabyte of data on supercomputers.[2] Only 5 percent served the main survey of bright galaxies; the rest unlocked this hidden structure.
Line Intensity Mapping: A Game-Changing Technique
HETDEX employed line intensity mapping, a method that captures cumulative spectral emissions from vast regions rather than individual objects. Scientists broke incoming light into spectra and combined them statistically to pinpoint peaks at the Lyman-alpha wavelength.
This approach used positions of over one million bright galaxies as anchors, inferring nearby faint sources based on gravity’s clumping effect. Julian Muñoz, a HETDEX scientist at the University of Texas at Austin, likened traditional surveys to mapping only bright cities from above, while intensity mapping blurs the view to include suburbs and small towns.[1]
The result marked the first precise Lyman-alpha intensity map, charting concentrations across cosmic volumes from the era dubbed “cosmic noon,” when star formation peaked.
Unraveling Gravity’s Role and Dark Energy’s Influence
The map enabled detailed analysis of galaxy clustering, a direct probe of gravity’s strength and matter distribution. Karl Gebhardt, HETDEX principal investigator at the University of Texas at Austin, noted that such clustering reveals mass quantities and gravitational properties.
By tracing density fluctuations, researchers tested models of dark energy, the force accelerating cosmic expansion. The findings offered real data to validate simulations of early structure formation.[3]
- Identified faint galaxies and gas in intergalactic voids.
- Confirmed Lyman-alpha peaks from 500,000 combined spectra.
- Enhanced understanding of star formation during peak epochs.
- Provided baselines for comparing element-specific maps, like carbon monoxide.
| Approach | Focus | Strength |
|---|---|---|
| Traditional Surveys | Bright galaxies | Precise positions |
| Line Intensity Mapping | All emissions | Comprehensive coverage |
Collaborative Effort Powers the Discovery
An international team, including Maja Lujan Niemeyer from the Max Planck Institute for Astrophysics and Robin Ciardullo from Penn State, led the analysis. The Hobby-Eberly Telescope at McDonald Observatory in Texas gathered the data, with processing at the Texas Advanced Computing Center.
Results appeared March 3, 2026, in The Astrophysical Journal. Eiichiro Komatsu, HETDEX scientist at Max Planck, emphasized how the map grounds simulations in observation.
Key Takeaways
- HETDEX’s map covers 9-11 billion years ago, revealing hidden hydrogen glow.
- Technique captures faint structures missed by galaxy catalogs.
- Insights refine gravity and dark energy models.
This luminous atlas signals a golden age for cosmic mapping, as new instruments complement HETDEX. It promises deeper probes into the universe’s hidden architecture and evolution. What do you think this reveals about our cosmic origins? Tell us in the comments.