
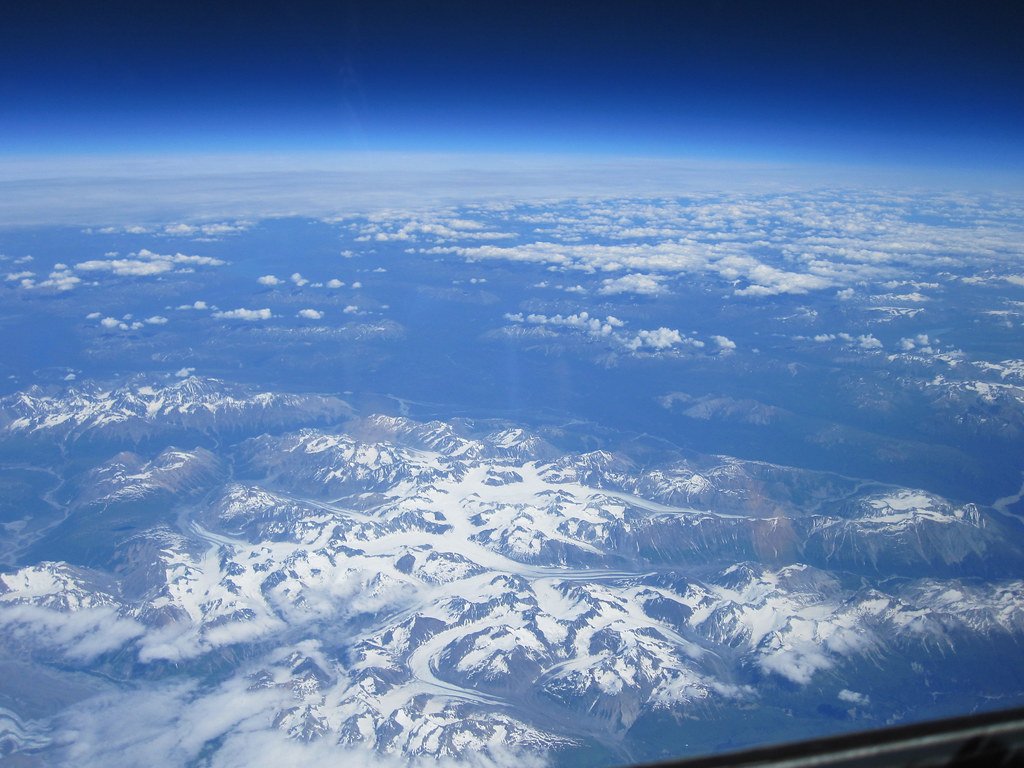
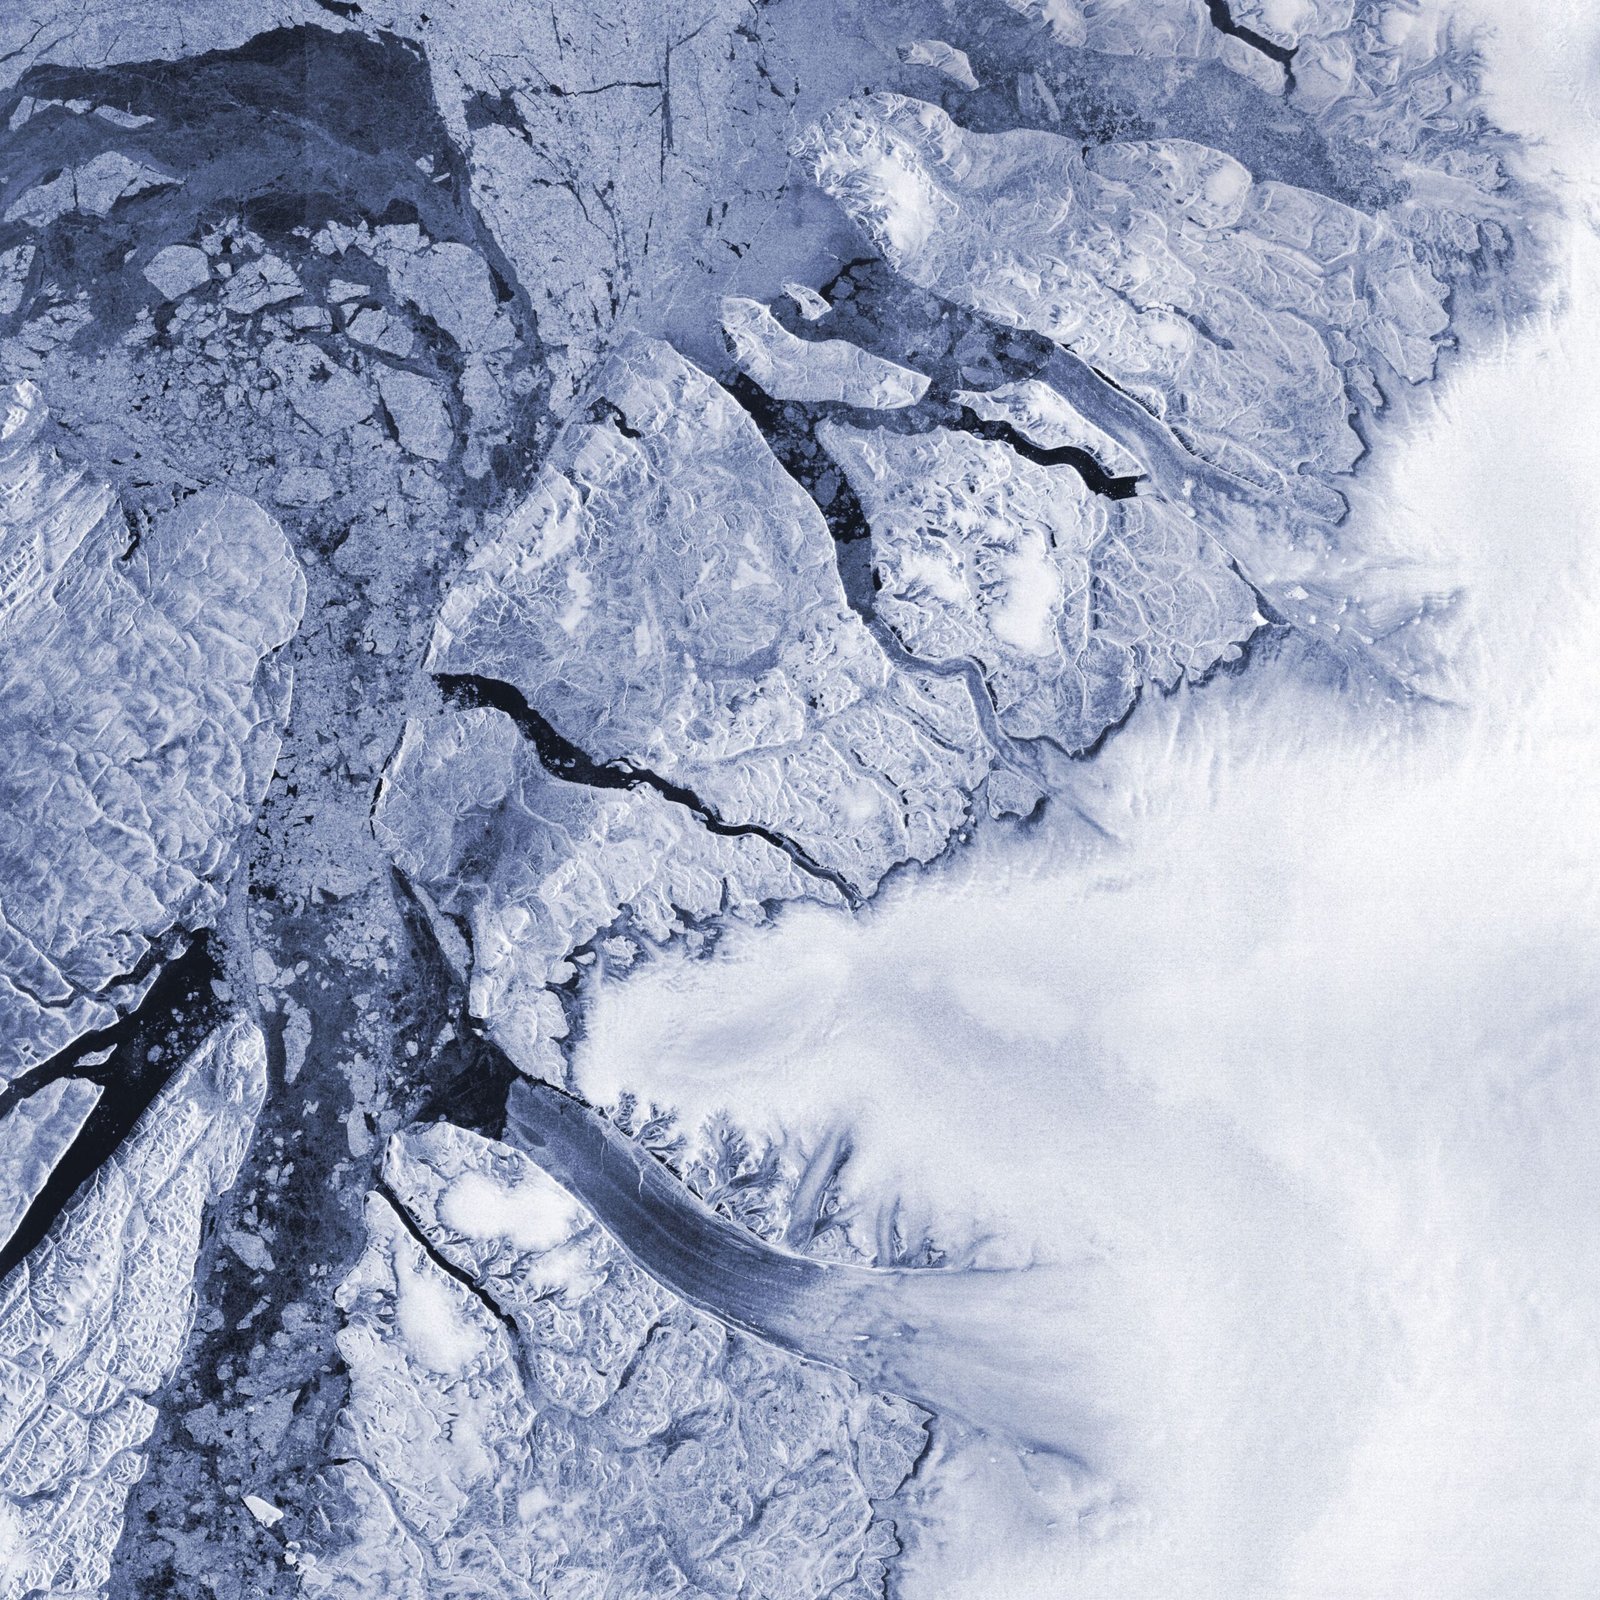
Every 16 days, a revolution occurs 438 miles above the Arctic Ocean. NASA’s Landsat satellites complete their orbital dance, capturing images that reveal one of Earth’s most dramatic transformations happening in real time. These mechanical sentinels don’t just take pretty pictures – they’re documenting the disappearance of an entire world made of ice.
The numbers are staggering, yet most people never see them coming. Arctic sea ice is vanishing at a rate of 13% per decade, and satellites are the only witnesses capable of measuring this massive change with pinpoint accuracy. Without these orbital observers, we’d be flying blind into one of the most significant environmental shifts in human history.
The Arsenal of Arctic Watchers
Multiple satellite systems work together like a coordinated surveillance network, each bringing unique capabilities to monitor the Arctic’s transformation. The European Space Agency’s Sentinel-1 satellites use radar technology that can peer through clouds and darkness, providing continuous coverage even during the Arctic’s months-long winter night. Meanwhile, NASA’s MODIS instruments aboard the Terra and Aqua satellites capture visible and infrared imagery that reveals ice thickness, temperature variations, and the subtle color changes that indicate melting.
Japan’s Advanced Microwave Scanning Radiometer and the Ice, Cloud, and land Elevation Satellite (ICESat-2) add laser altimetry measurements that can detect changes in ice thickness down to centimeters. This technological symphony creates a comprehensive picture that no single instrument could achieve alone.
Radar Vision Through Arctic Storms

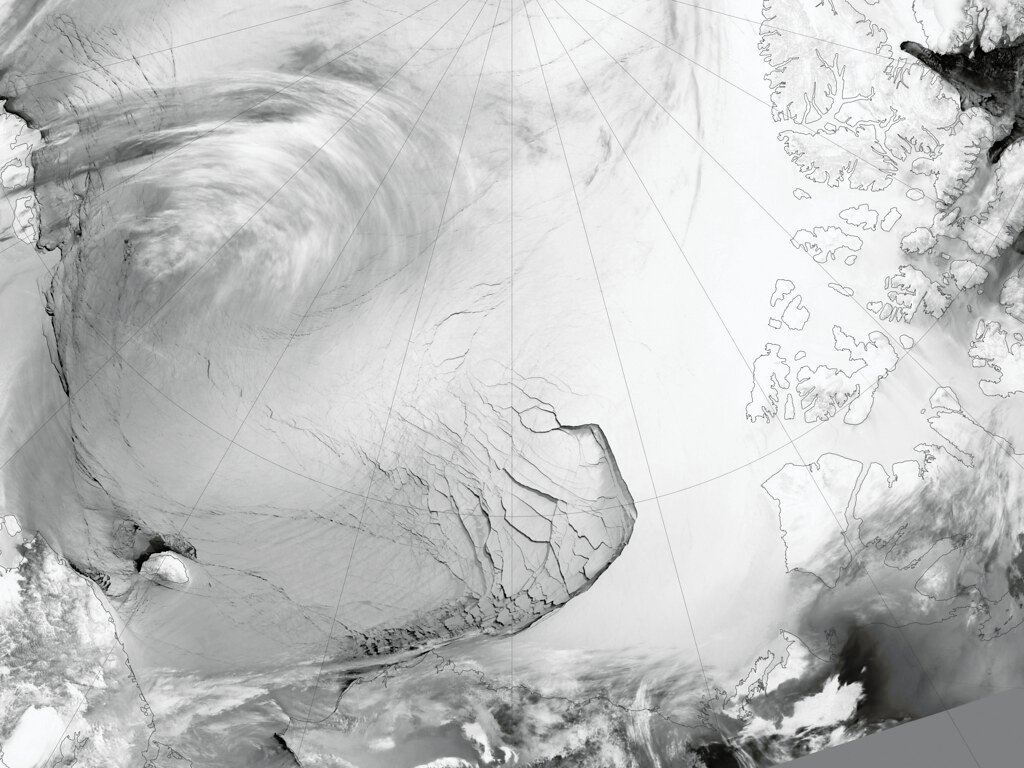
Synthetic Aperture Radar (SAR) technology represents perhaps the most crucial breakthrough in Arctic monitoring. Unlike optical cameras that need clear skies and sunlight, SAR satellites can penetrate clouds, fog, and the polar night that shrouds the Arctic for months. These systems send microwave pulses toward Earth and analyze the returned signals to create detailed images of ice coverage and movement.
The Canada-Italy RADARSAT constellation provides some of the most detailed SAR imagery available, with resolution fine enough to distinguish between different types of sea ice. First-year ice reflects radar signals differently than multi-year ice, allowing scientists to track not just the extent of ice coverage but also its age and stability.
This technology has revealed surprising discoveries about Arctic ice dynamics. Scientists have observed ice floes moving at speeds previously thought impossible, with some sections drifting over 25 miles in a single day during storm events.
The Thermal Signature of a Changing Arctic
Infrared sensors aboard satellites detect heat signatures invisible to human eyes, revealing the thermal dynamics driving Arctic ice loss. These instruments measure sea surface temperatures, identifying warm water currents that flow beneath ice sheets and accelerate melting from below. The data shows that ocean temperatures in some Arctic regions have risen by more than 2°C in just two decades.
Thermal imaging also reveals the formation of polynyas – areas of open water surrounded by ice – which act like windows releasing ocean heat into the frigid Arctic atmosphere. These thermal vents can span hundreds of square miles and significantly impact local weather patterns and wildlife habitats.
Measuring Ice Thickness from Space
Determining ice thickness from orbit requires sophisticated laser technology that can measure distances with incredible precision. NASA’s ICESat-2 satellite fires laser pulses at the rate of 10,000 times per second, measuring the time it takes for light to travel from the satellite to the ice surface and back. By combining these measurements with knowledge of water levels, scientists can calculate ice thickness across vast areas.
The data reveals that Arctic sea ice has not only shrunk in area but has also become dramatically thinner. Multi-year ice, which once formed the backbone of the Arctic ice pack, has decreased by more than 40% since the 1980s. This thinning makes the remaining ice more vulnerable to breakup and melting, creating a feedback loop that accelerates ice loss.
Real-Time Data Streams and Processing
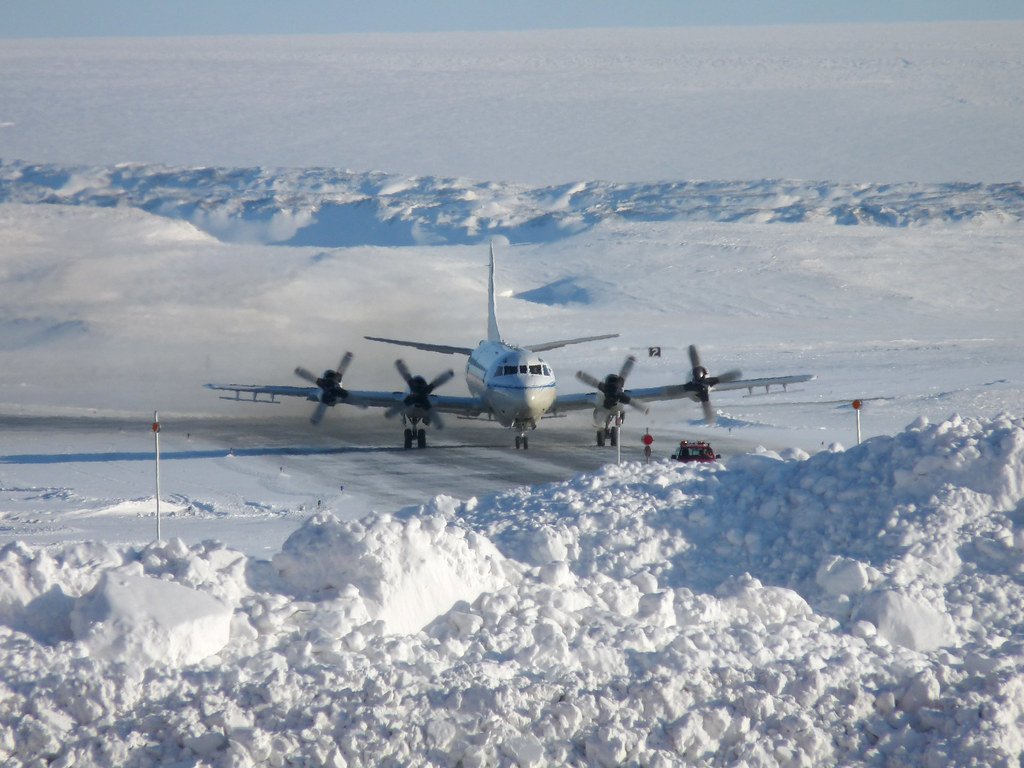
Modern Arctic monitoring satellites transmit data to Earth within hours of collection, enabling near real-time analysis of changing conditions. Ground stations in Alaska, Norway, and Canada receive these transmissions and relay them to processing centers where supercomputers analyze the information. The National Snow and Ice Data Center processes over 30 terabytes of satellite data annually, creating daily updates on Arctic ice conditions.
Machine learning algorithms now help identify patterns in this massive data stream that human analysts might miss. These systems can detect the early formation of leads (cracks in the ice) that may predict larger breakup events weeks in advance.
Tracking Ice Movement and Drift Patterns
Satellites reveal that Arctic ice is not static but constantly moving in complex patterns driven by winds, currents, and the Coriolis effect. The Transpolar Drift Stream carries ice from the Siberian coast across the Arctic Ocean toward the Fram Strait, where much of it eventually melts. Satellite tracking shows this drift pattern has accelerated, with ice now crossing the Arctic Ocean in 2-3 years instead of the historical 4-5 years.
GPS-equipped ice buoys deployed by researchers provide ground truth data that validates satellite observations. These buoys transmit their positions daily, creating detailed maps of ice movement that help scientists understand the forces reshaping the Arctic landscape.
The Science of Albedo and Feedback Loops
Satellite measurements of albedo – the amount of sunlight reflected by ice and snow – provide crucial insights into Arctic warming feedback loops. Fresh snow can reflect up to 90% of incoming solar radiation, while dark ocean water absorbs more than 90% of the sun’s energy. As ice melts and exposes darker ocean surfaces, more heat is absorbed, accelerating further melting in a process scientists call the ice-albedo feedback.
Spectral analysis from satellites can distinguish between different types of ice and snow surfaces, tracking how albedo changes throughout the melting season. This data helps climate scientists understand why Arctic warming occurs twice as fast as the global average, a phenomenon known as Arctic amplification.
Detecting Melt Ponds and Surface Changes
High-resolution satellite imagery reveals the formation of melt ponds – pools of water that form on ice surfaces during warmer months. These dark pools absorb more heat than surrounding ice, creating localized warming that can trigger rapid ice breakup. Satellites can track the formation, growth, and drainage of these ponds across millions of square miles of Arctic ice.
Advanced image processing techniques allow scientists to measure not just the area covered by melt ponds but also their depth and the rate at which they expand. This information helps predict which ice regions are most vulnerable to complete melting during summer months.
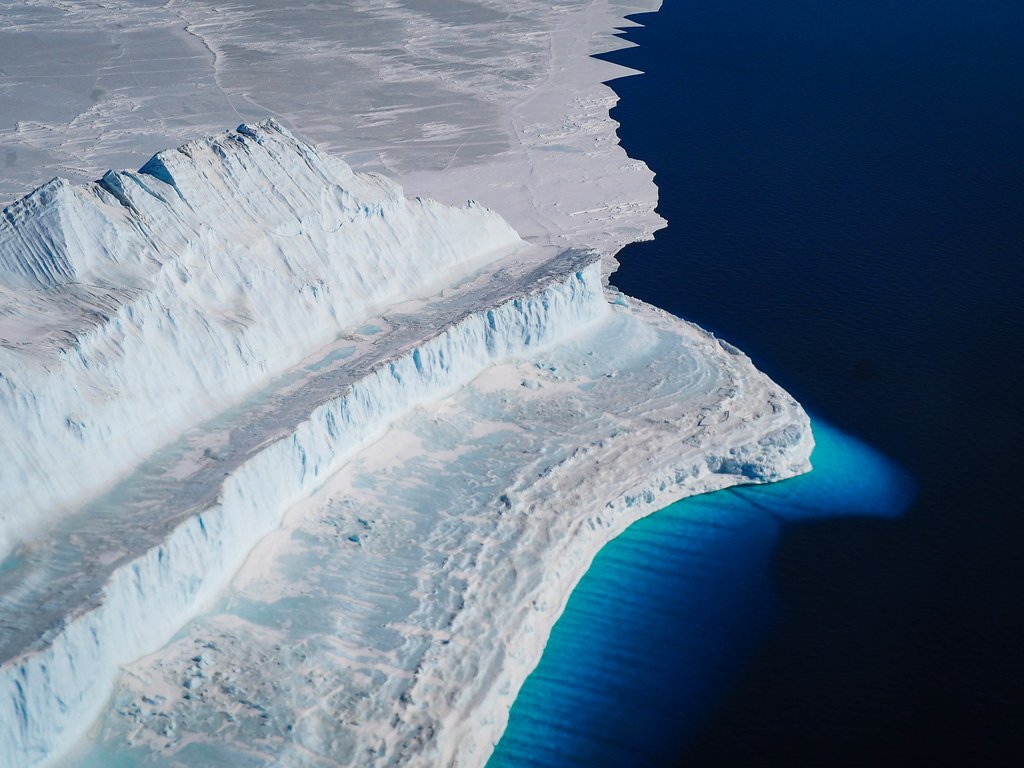
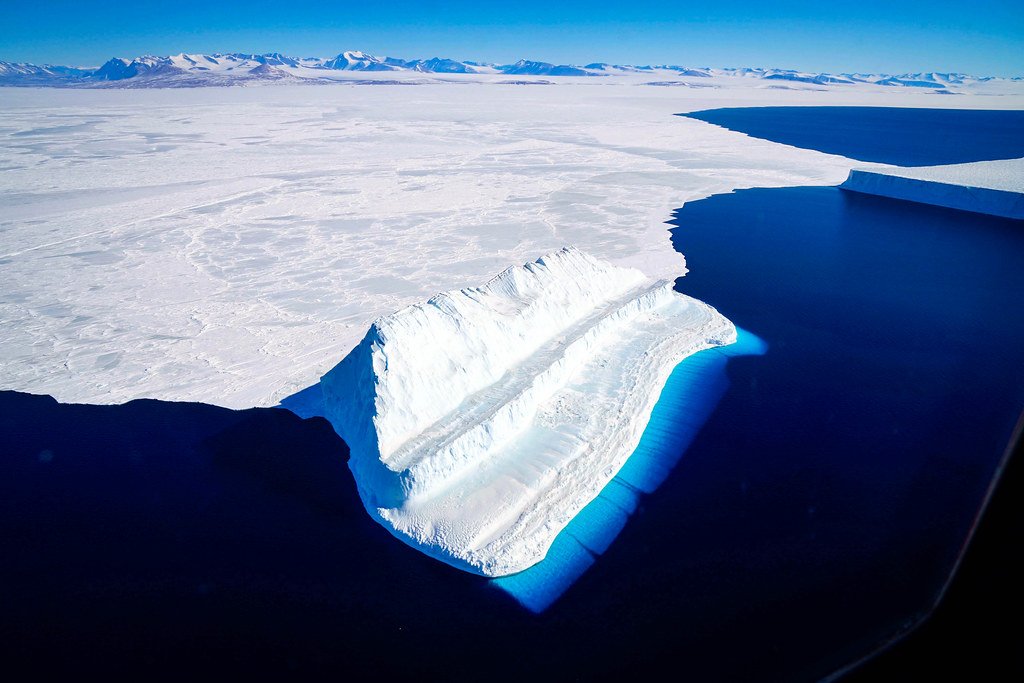
Monitoring Glacial Ice Loss
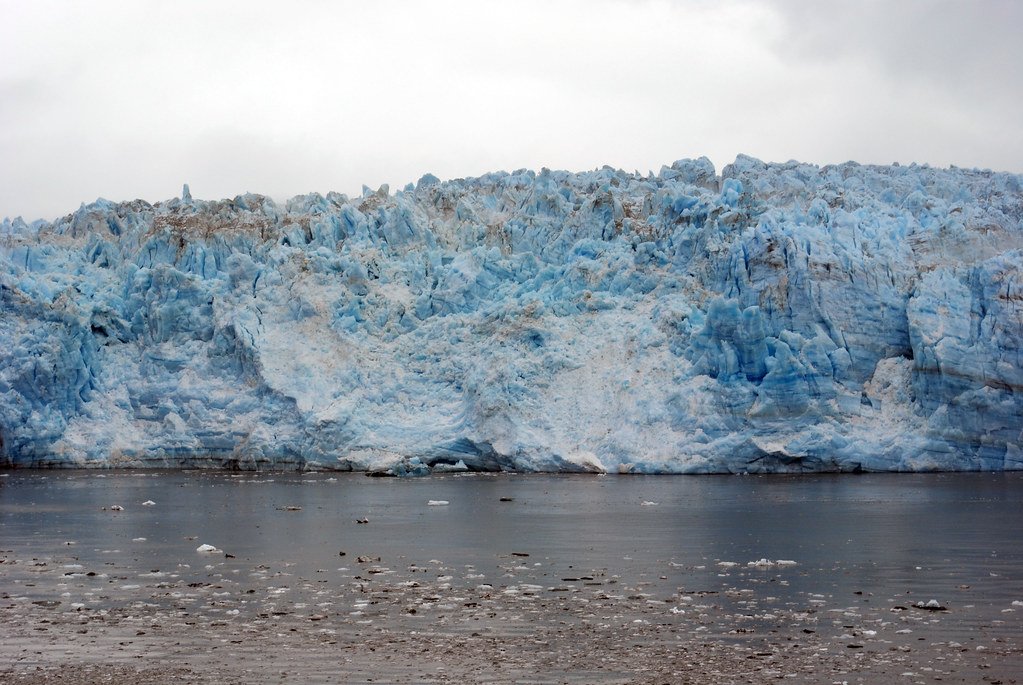
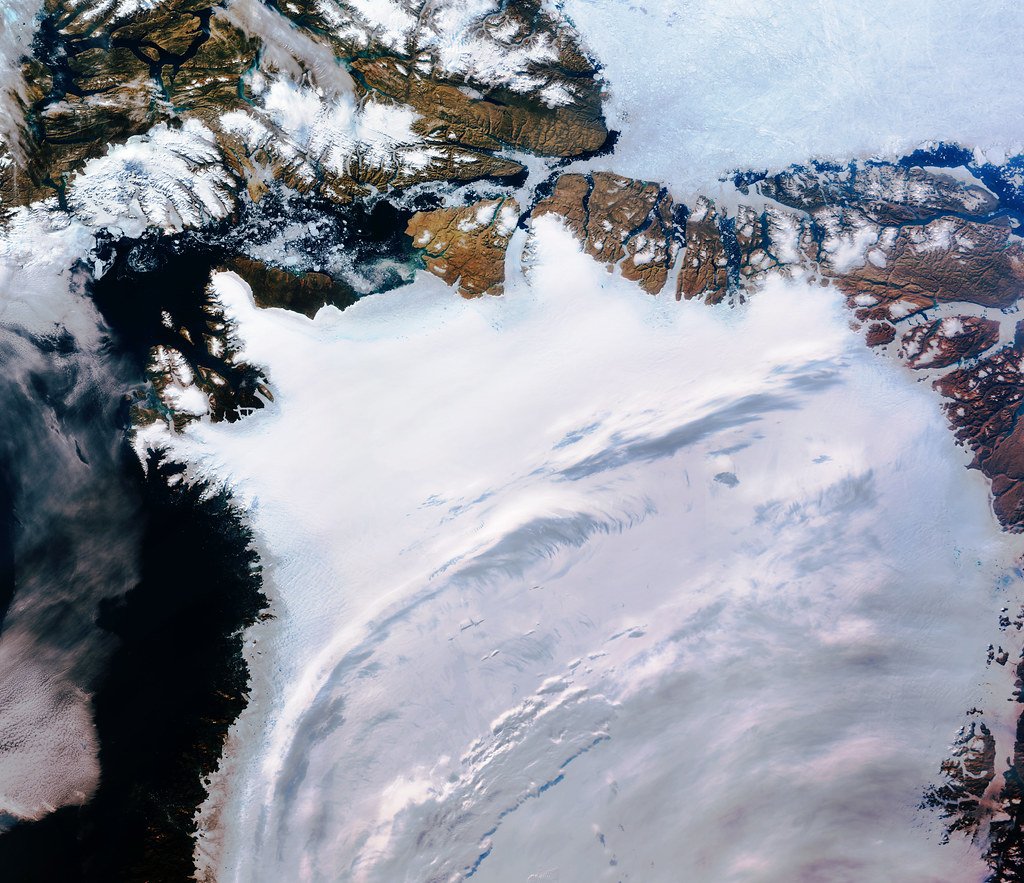
While sea ice captures much attention, satellites also monitor the massive ice sheets and glaciers that contribute to sea level rise. The Gravity Recovery and Climate Experiment (GRACE) satellites measure tiny changes in Earth’s gravitational field caused by shifting ice mass. These measurements reveal that Greenland loses approximately 280 billion tons of ice annually – equivalent to the weight of 1.4 million Empire State Buildings.
Optical satellites provide complementary data by tracking the retreat of glacier termini and the acceleration of ice flow into the ocean. Time-lapse imagery from satellites shows glaciers that once moved mere feet per year now advancing toward the sea at rates exceeding 100 feet per day.
Weather and Climate Integration
Satellite data integration with weather models helps scientists understand how Arctic ice loss affects global climate patterns. The polar vortex, jet stream positioning, and regional weather events all show connections to Arctic ice conditions. Satellites provide the continuous monitoring needed to identify these relationships and improve weather prediction models.
Atmospheric profiling instruments aboard satellites measure temperature, humidity, and wind patterns above the Arctic, revealing how ice loss affects local weather systems. This data shows that reduced ice coverage leads to increased evaporation, affecting precipitation patterns across the northern hemisphere.
Wildlife and Ecosystem Monitoring
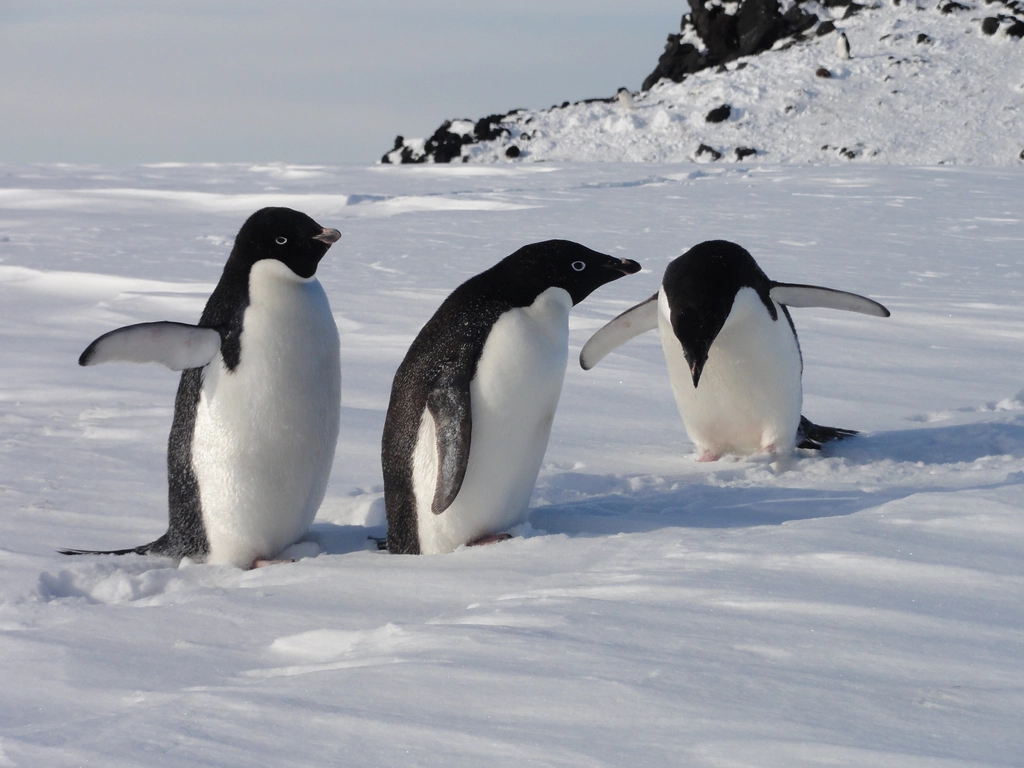
Satellite observations extend beyond ice to monitor the ecosystems that depend on Arctic ice. High-resolution imagery can detect polar bear populations, track their movements, and identify critical habitat areas. Scientists use satellite data to estimate seal populations by counting breathing holes in the ice and monitoring pupping areas.
Ocean color sensors aboard satellites detect phytoplankton blooms in newly ice-free waters, revealing how marine ecosystems respond to changing ice conditions. These biological indicators help scientists understand the broader ecological impacts of Arctic ice loss on food webs and marine biodiversity.
Ice Forecasting and Prediction Models
Satellite data feeds into sophisticated computer models that attempt to predict future Arctic ice conditions. These models integrate ice thickness, temperature, wind patterns, and ocean currents to forecast ice behavior weeks to months in advance. The European Centre for Medium-Range Weather Forecasts now issues operational Arctic ice forecasts based heavily on satellite observations.
Artificial intelligence systems trained on decades of satellite data can identify patterns that improve prediction accuracy. These systems help shipping companies plan routes through the Arctic and assist researchers in timing field studies to maximize safety and scientific value.
Shipping Route Optimization
Commercial shipping companies now rely on satellite-derived ice charts to navigate Arctic waters safely and efficiently. The Northern Sea Route along Russia’s coast and the Northwest Passage through the Canadian Arctic are becoming increasingly navigable, with satellite data providing real-time updates on ice conditions. This information helps ships avoid dangerous ice while minimizing fuel consumption and transit time.
Satellite monitoring also tracks the environmental impact of increased Arctic shipping, measuring black carbon deposits from ship exhaust that accelerate ice melting. This dual monitoring capability helps balance economic opportunities with environmental protection.
International Cooperation and Data Sharing
Arctic monitoring requires unprecedented international cooperation, with satellite data shared freely among research institutions worldwide. The Global Climate Observing System coordinates satellite observations from multiple countries, ensuring comprehensive coverage of Arctic regions. This cooperation proves essential because Arctic ice loss affects global climate patterns regardless of national boundaries.
The Arctic Council, comprising eight Arctic nations, relies heavily on satellite data for policy decisions regarding Arctic development, conservation, and Indigenous rights. Real-time monitoring capabilities help inform emergency response efforts and resource management decisions across the circumpolar north.
Future Satellite Missions
Next-generation satellite missions promise even more detailed Arctic monitoring capabilities. The European Space Agency’s CRISTAL mission, scheduled for launch in 2027, will provide improved ice thickness measurements and better tracking of ice motion. NASA’s planned ICESat-3 mission will offer enhanced laser altimetry with greater precision and coverage.
Proposed commercial satellite constellations could provide hourly updates on Arctic ice conditions, enabling unprecedented temporal resolution for monitoring rapid changes. These developments will transform our understanding of Arctic dynamics and improve our ability to predict and respond to ongoing changes.
The Human Story Behind the Data
Behind every satellite image and data point lies a human story of communities adapting to rapidly changing conditions. Indigenous peoples across the Arctic report that traditional knowledge about ice conditions no longer applies, as satellite data confirms the breakdown of predictable seasonal patterns. Villages that once relied on sea ice for hunting and transportation now face isolation as ice becomes unreliable.
Scientists working with satellite data often describe an emotional weight to their work, watching an entire ecosystem disappear in real time through their computer screens. The objective measurements reveal subjective realities of loss, adaptation, and resilience that satellite technology makes visible to the world.
Yet this same technology offers hope through understanding. By documenting these changes with unprecedented detail and accuracy, satellites provide the evidence needed to drive policy decisions and adaptation strategies. The Arctic may be shrinking, but our ability to monitor, understand, and respond to these changes has never been more sophisticated.
The satellites orbiting overhead continue their silent vigil, recording every crack, melt, and shift in the Arctic landscape. Their data streams tell the story of a world in transition, measured in pixels and temperatures, but ultimately about the future of our planet. What will their next orbit reveal?