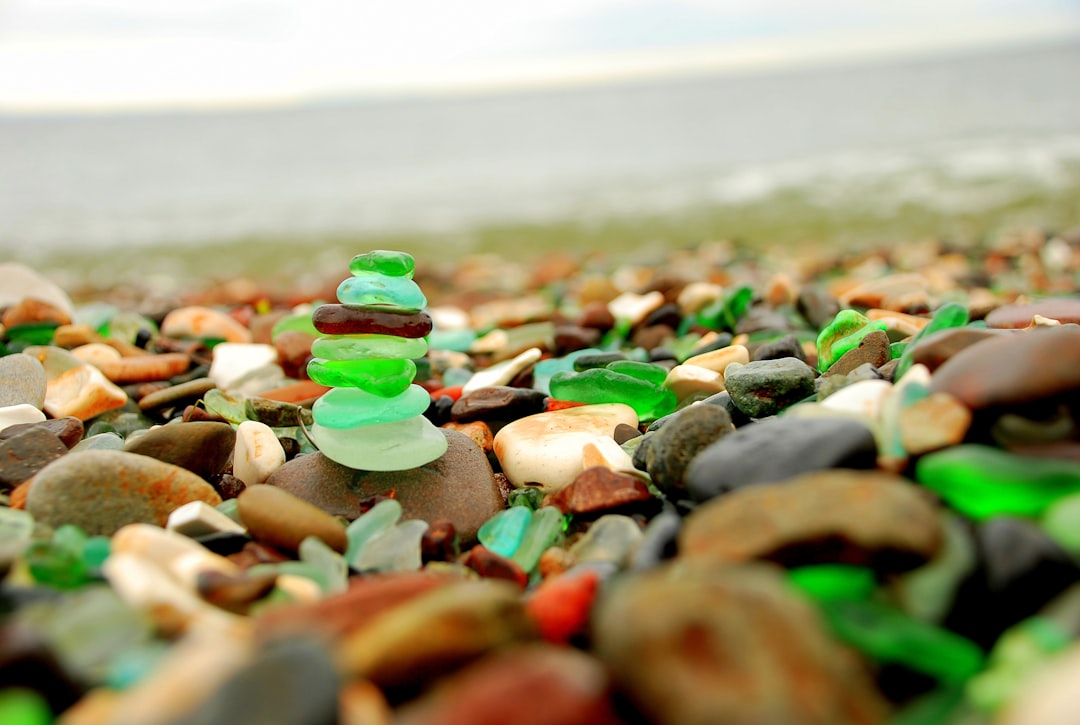
Glass begins as fire-fused sand: melt silica hot and cool it fast, and you get a liquid frozen in place. Nature has done this for ages through volcanoes that cast obsidian, lightning that welds dunes into fulgurites, and meteor strikes that splash tektites across landscapes. Today, tides rework a different kind of glass – discarded bottles and plates from harbors, dumps, and ship lanes – into matte, wave-sanded clues. Each rounded shard acts like a time-stamped pebble, logging wave energy, shoreline shape, and the gritty chemistry of seawater. Along a dozen U.S. beaches, that glimmering debris doesn’t just look pretty; it reads like a field notebook of coastal change.
Fort Bragg, California – The Hidden Clues in a Wave-Tossed Kiln
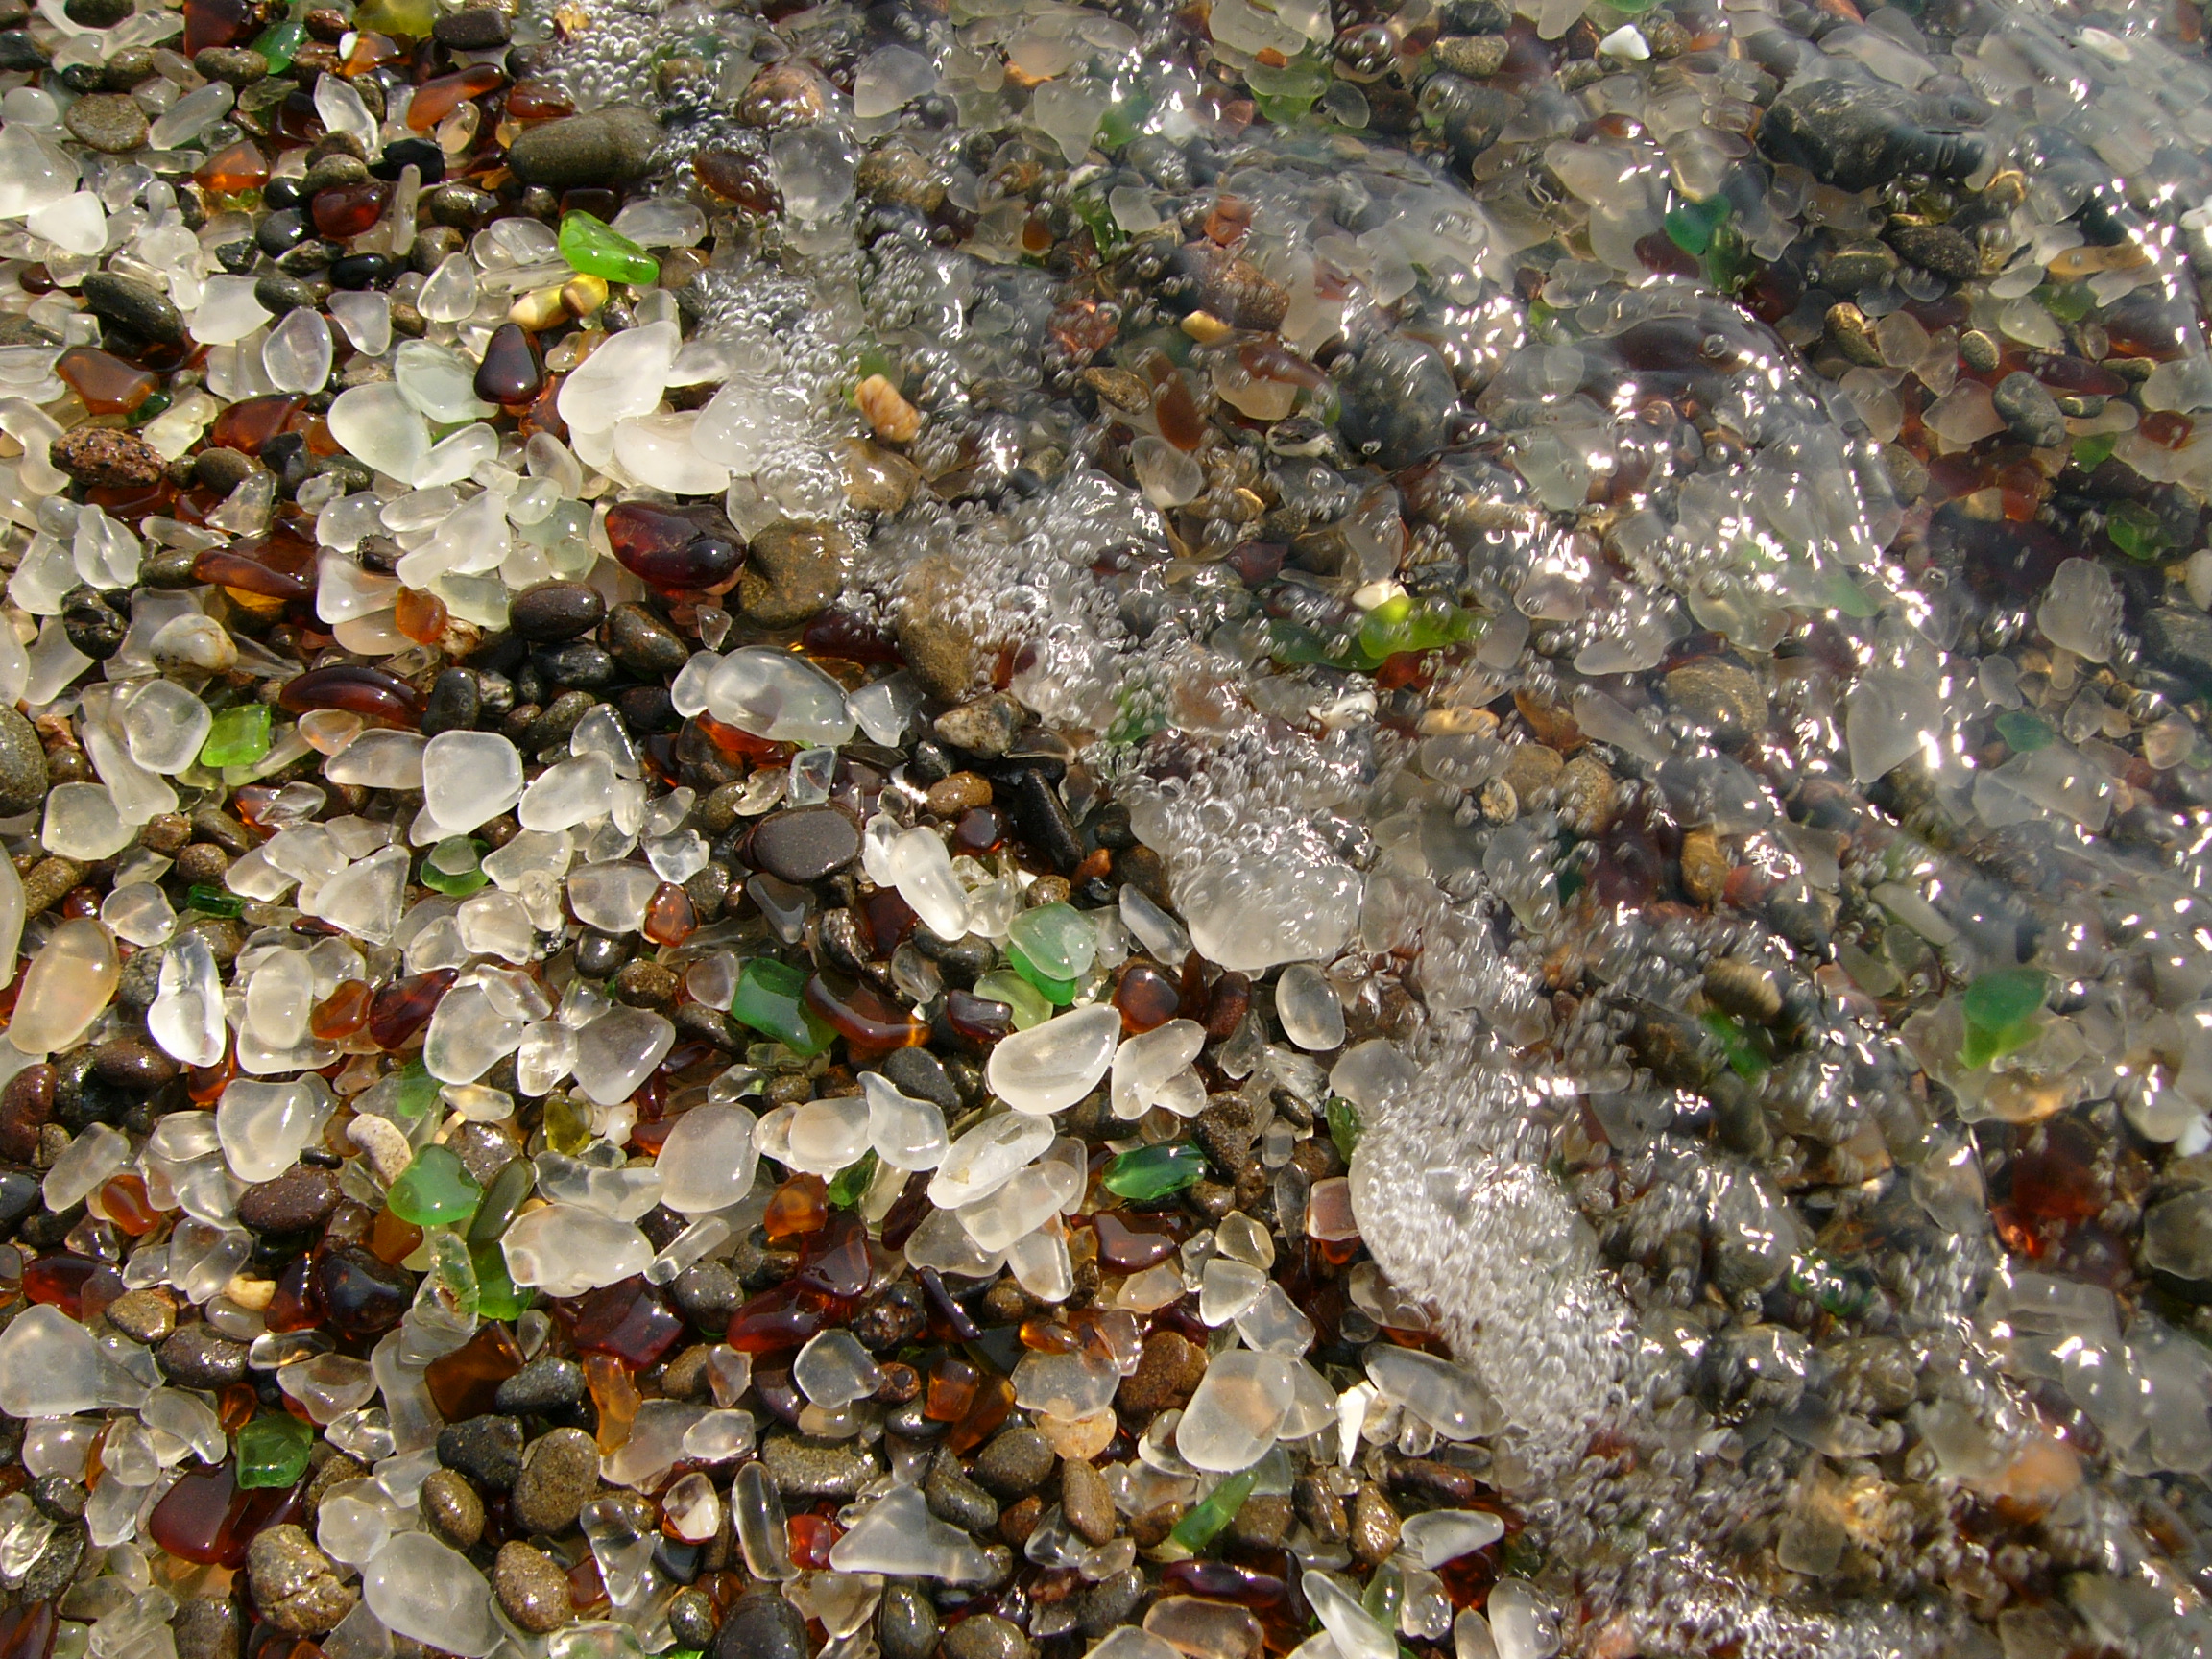
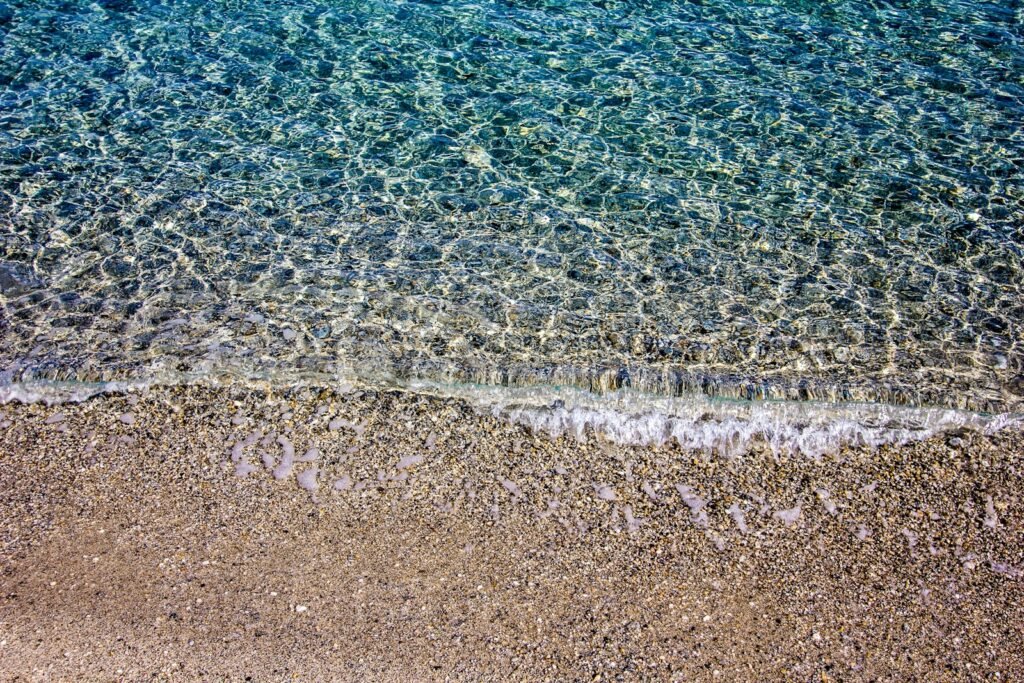
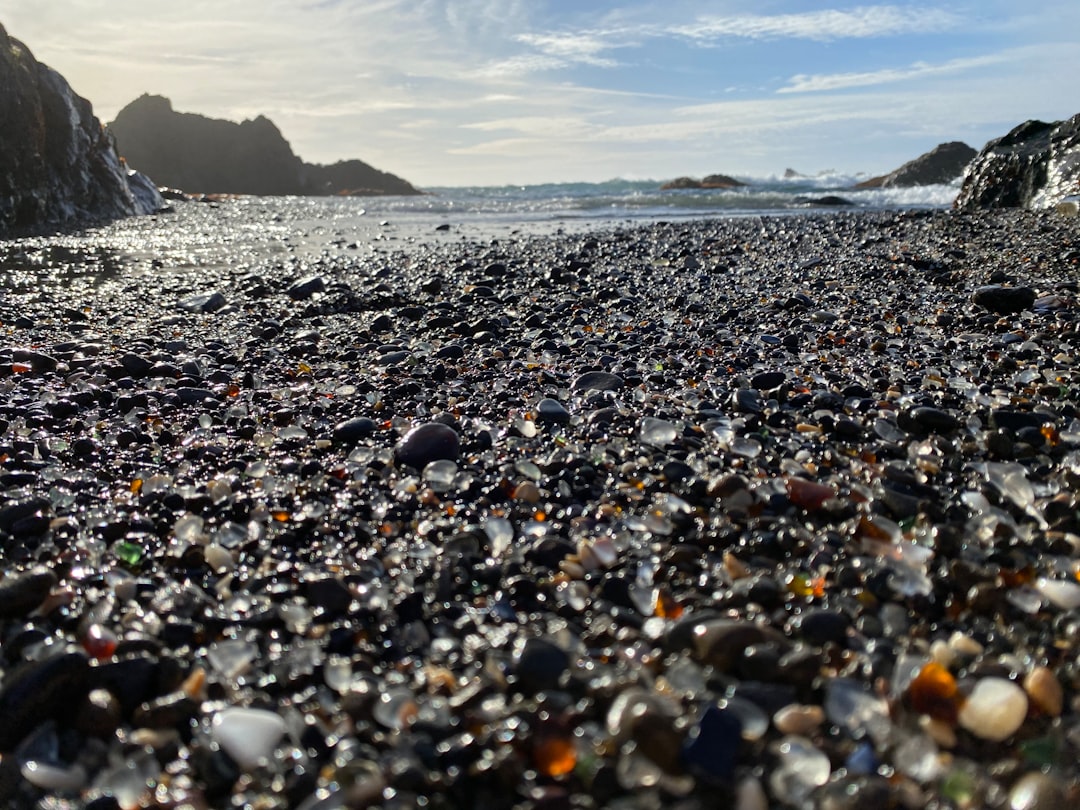
Here, the shore glitters like a cracked kaleidoscope, but the real story is physics. Fort Bragg’s pocket coves trap glass the way a cupped hand holds marbles, and repeated wave swash grinds every edge to satin. The surrounding graywacke headlands focus surf, boosting abrasion rates that sort heavier, thicker shards low on the beach face and lighter fragments higher. That vertical sorting doubles as a tide ruler: after big swells, larger, rounder pieces stack in the storm berm like breadcrumbs left by the sea.
Geologically, the cove’s shape matters as much as the material. Narrow mouths intensify backwash, which acts like sandpaper and tumbler in one. The frosted patina – microscopic pitting and a delicate hydration rind – tells you the water stayed oxygenated and the shards lingered, not sprinted, through the longshore current. Local rules often discourage removal, so the landscape can keep telling its story.
Davenport, California – Confetti from a Pacific Conveyor
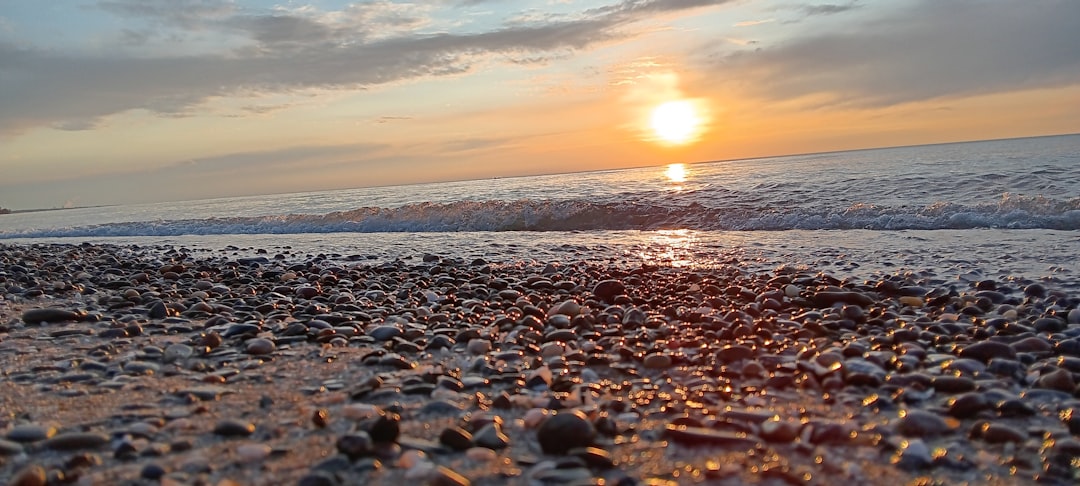
North of Santa Cruz, shards of brilliant teal and milk-white sweep ashore after winter storms like confetti spilled from a sky. Those fragments trace back to historic art-glass cullet, but the reveal is how quickly the Pacific can mobilize heavy material. When long-period swells line up with the submarine canyon, wave energy concentrates and briefly opens a fast lane for glass to leap from deep pockets to the swash zone. I’ve stood here after a January storm and watched colors roll in sets, each pulse a new data point on energy spikes.
The rounding at Davenport is different from Fort Bragg’s quiet tumbling. Here, fewer, sharper pieces can appear between events, hinting at short, high-energy transport rather than slow residency. That contrast lets you read the exposure: storm-driven, canyon-assisted bursts versus everyday polishing. The beach itself becomes a logbook of swell period and direction.
Port Townsend, Washington – Straits, Tides, and a Glassy Ledger
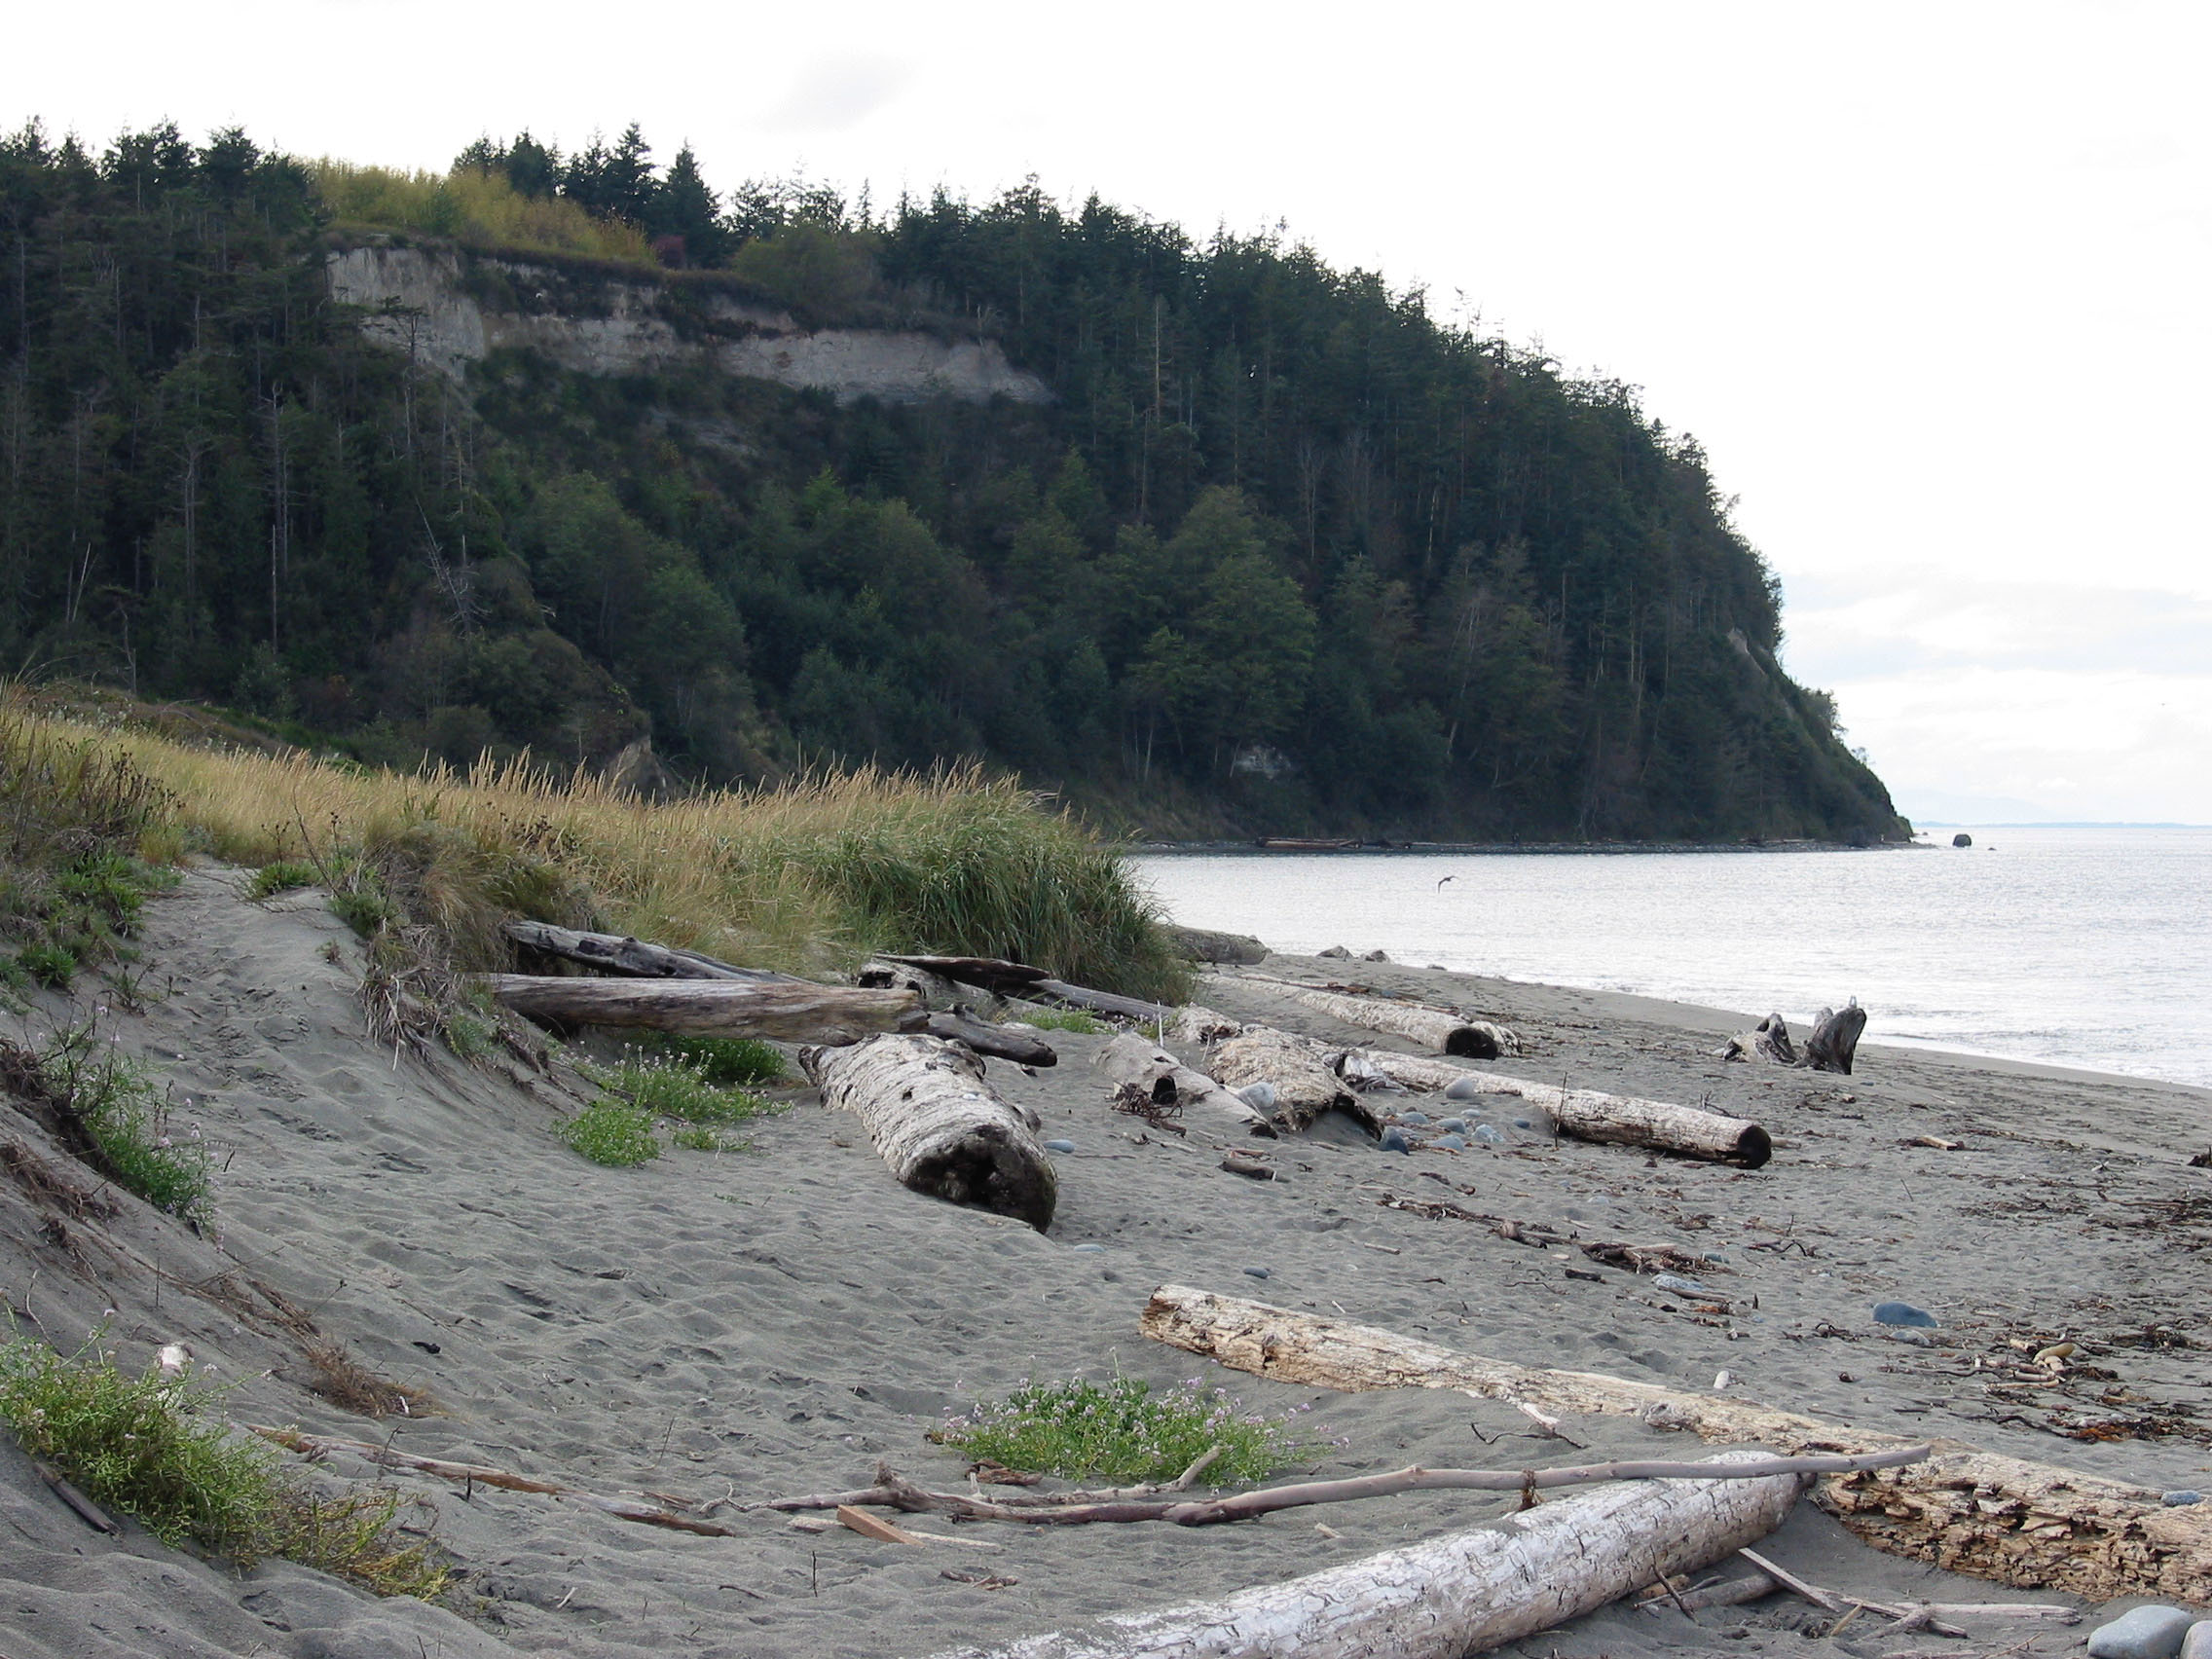
On the edge of the Strait of Juan de Fuca, Port Townsend’s “Glass Beach” sits where tidal currents shear past a glacially carved shore. The mix of cobbles and compacted till creates a high-friction runway that scours glass quickly, frosting it faster than on silty flats. Twice-daily current reversals act like a geological metronome, nudging shards north, then south, while storms write bolder verses across the foreshore. The result is a beach that wears its energy gradients on its sleeve.
Look closely and you’ll see color clustering around small headlands and drift logs. Those micro-barriers form eddies, low-energy pockets where lighter fragments accumulate and hydrate. Meanwhile, thicker bottle-bottom disks tend to stall where cobbles stack into cusps, a tell for cuspate beach morphology. Every shard is a tracer that maps the pulse of the strait.
Glass Beach, Kauai – Basalt Sands, Warm Seas, and Fast Patina

Near Port Allen, a cove mottled with brown and green glass meets black basalt sand and shredded coral. In warm, alkaline water, glass weathers with a delicate rind that softens edges faster than in cold seas, so pieces here can look older than their years. Basalt grains add grit, upping the abrasion per wave and speeding the tumble. The color palette – lots of browns and greens – quietly testifies to everyday sources like food and beverage glass tied to port life.
The geometry of the cove limits escape, which creates a feedback loop: the longer shards stay, the smoother they get. Storm seasons punctuate that process, pushing the coarser mix higher on the berm and winnowing fines seaward. You can read the story in one glance: warm water chemistry, volcanic sandpaper, and a semi-closed pocket that functions like a natural rock tumbler.
Dead Horse Bay, Brooklyn, New York – Erosion Exposes a Century’s Archive
Along the urban edge of Jamaica Bay, eroding fill feeds glass to a low, tidal shoreline where history mingles with salt. The shards here tell an unvarnished tale of landfill erosion and rising water nibbling at old edges. Instead of isolated coves, the bay’s broad, shallow geometry favors slow, lateral shuffles of material, so pieces can remain angular longer. Frosting forms, but more patchily, hinting at short residence and brackish chemistry.
Glass distribution mirrors the bay’s wind setup: strong onshore winds stack water and debris, then retreat, leaving bands of mixed-age material. It’s a living case study in how human-made shorelines age under wave climate change. Local authorities adjust access and guidance as conditions evolve, a reminder that the past doesn’t stay buried when coasts are on the move.
Spectacle Island, Massachusetts – A Managed Coast that Still Speaks
Built from fill and later reshaped as a park, Spectacle Island wears its engineered origins honestly. Harbor fetch is short, which means lower wave energy; the trade-off is time – glass lingers and slowly rounds under countless small laps. The matte finish forms steadily, showing that you don’t need oceanic surf for a clean frost, just persistence and gritty sand.
Here, stewardship decisions are part of the story, because management affects how material cycles. You can watch how gentle waves and periodic storms build parallel berms, then let tides sort lighter colors into arcs. It’s a forgiving laboratory for reading how fetch, grain size, and shoreline management interact to shape the life of a shard.
Cape May, New Jersey – Where the Bay Meets the Atlantic
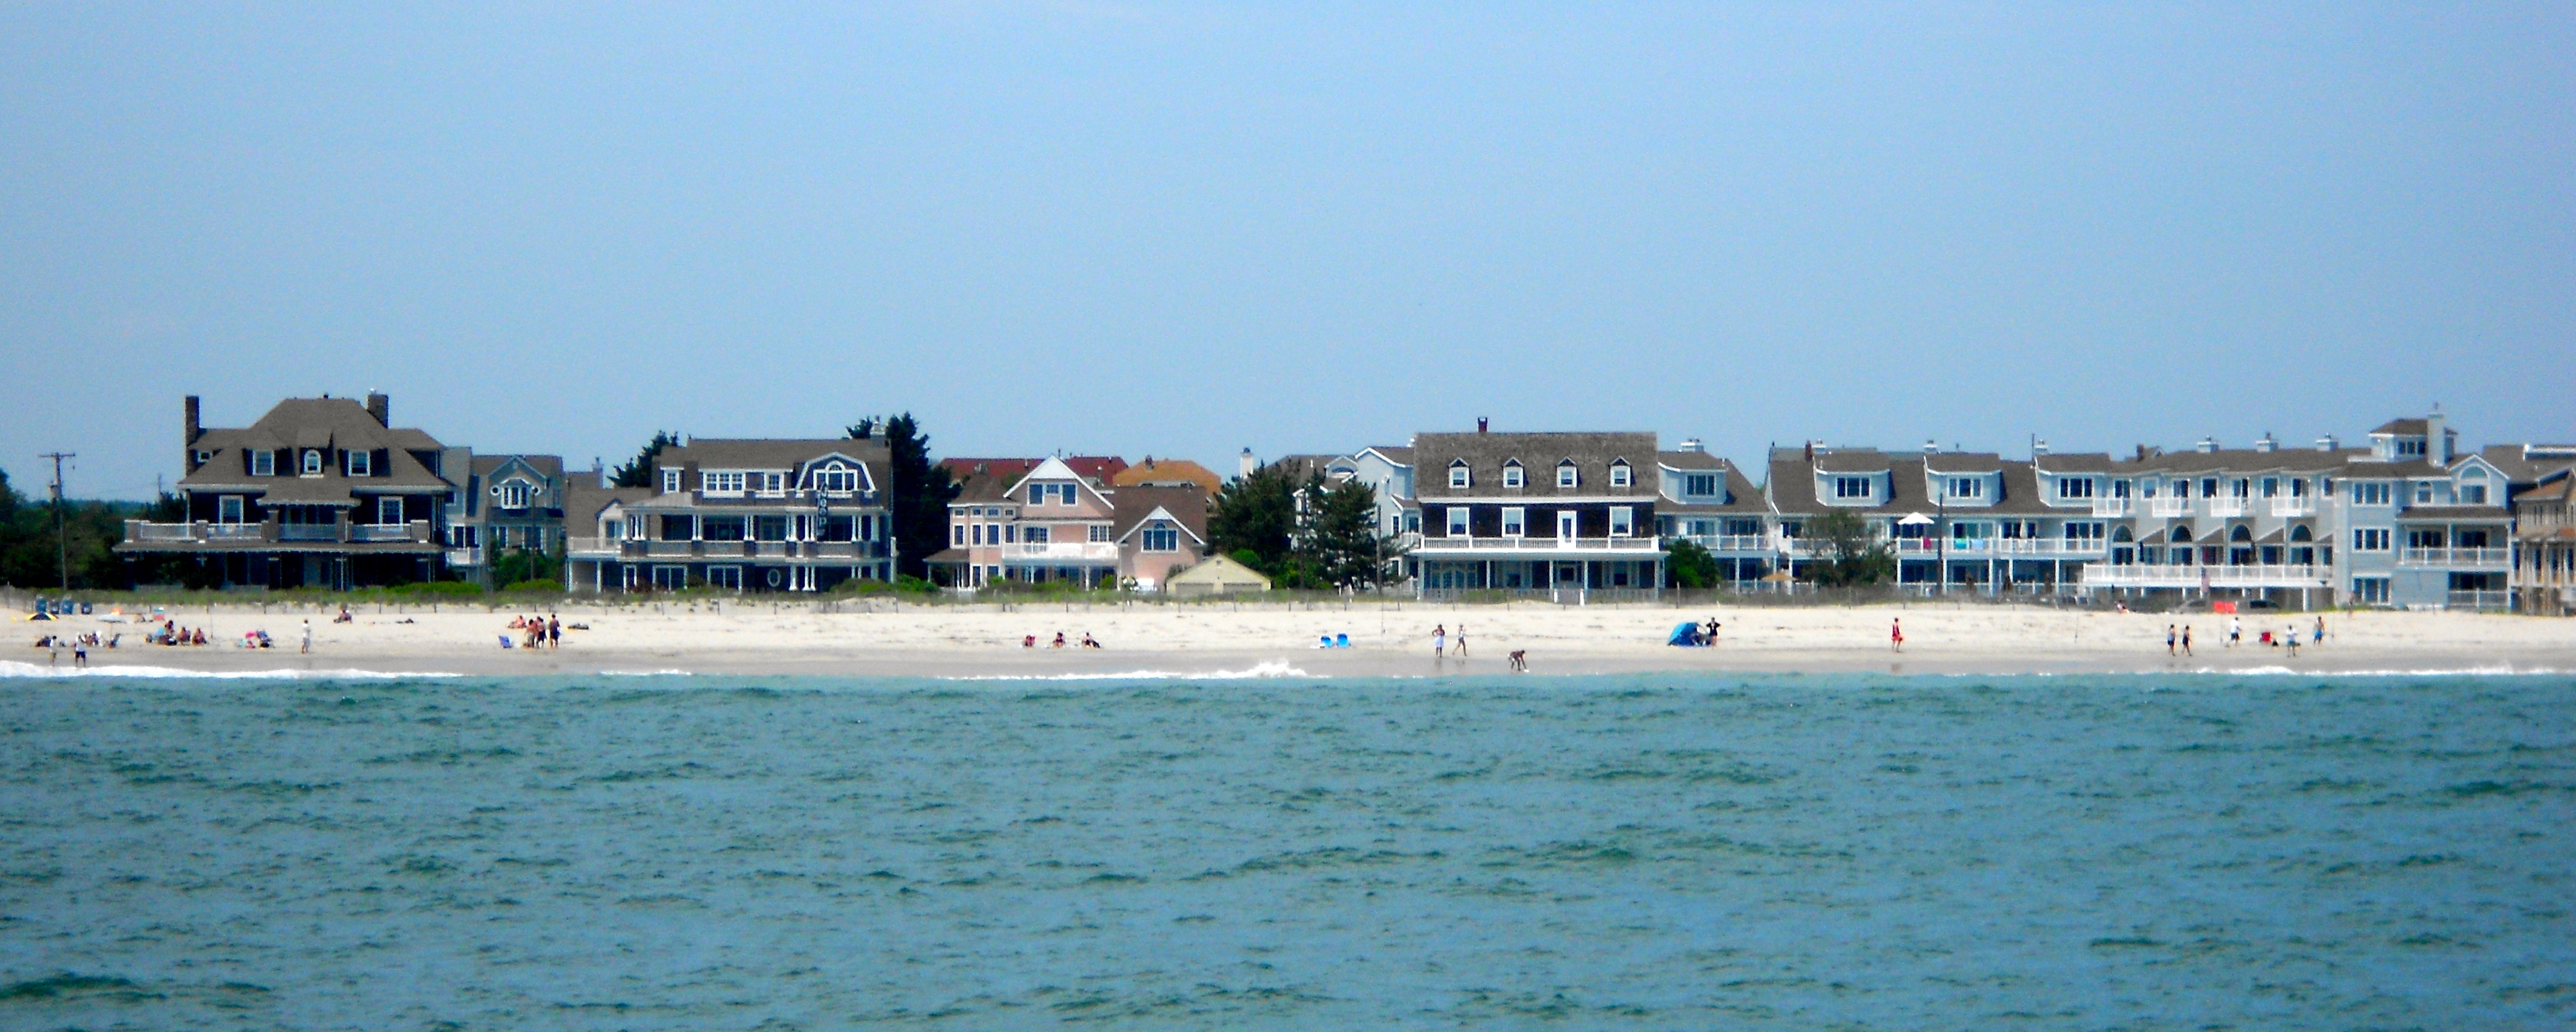
At the southern tip of New Jersey, currents wrap the cape like a moving belt, shuttling quartz sand and the occasional glass fragment around jetties and points. Sunset Beach often shows neat size-sorting after nor’easters, with smoother, thicker glass resting beside rounded quartz pebbles sometimes called local “diamonds.” Those pairings are handy: glass and quartz tumble differently, so their co-occurrence hints at the exact mix of energy and residence time.
Longshore drift here is the main courier, so colors can trace circulation patterns around groins. After storms, the berm records a sequence – heavier, rounder debris up high; lighter, thin flakes lower – like stratigraphy written overnight. Reading it teaches you the choreography of a cape under seasonal winds.
Cape Henlopen, Delaware – Eddies, Breakwaters, and Slow-Turned Frost
Where breakwaters calm the sea, glass reveals what quiescence can do. At Cape Henlopen, partial shelter creates eddies that collect fines, slow abrasion, and encourage steady hydration rinds on thin shards. The frosting looks velvety, the trademark of low-to-moderate energy with lots of time in suspension before settling again.
That pattern doubles as a lesson in coastal engineering. Structures alter wave approach and set up retention zones, which in turn shape how and where glass matures. If Fort Bragg is the fast tumbler, Cape Henlopen is the slow cooker – same ingredients, different tempo.
North Beach, Maryland – Brackish Signals on the Chesapeake
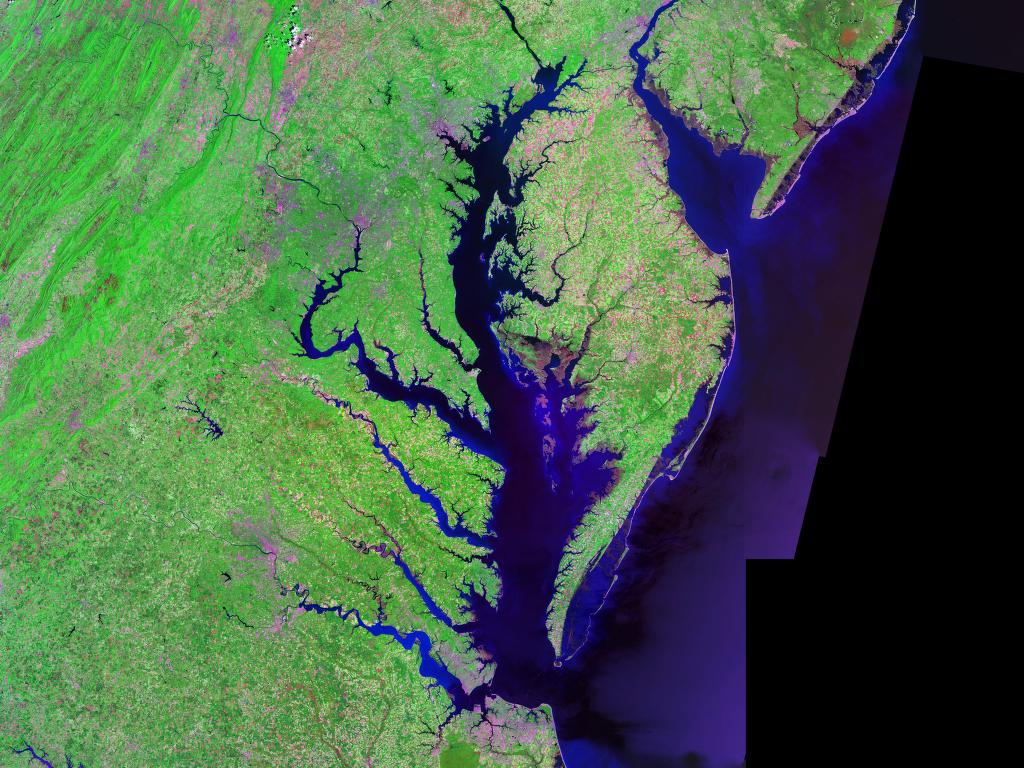
On the Chesapeake Bay, brackish water lowers overall energy and tweaks the chemistry of weathering. Glass can stay slightly sharper, with frosting that’s thin and discontinuous, a sign of shorter, repeated transits rather than continuous churn. When a nor’easter blows through, the shoreline briefly flips to high energy and lays down a coarse, well-sorted ribbon above the normal wrack line.
Those ribbons are the bay’s margin notes. Their thickness and grain mix track the severity and duration of each event, teaching the same lessons geologists read in storm deposits elsewhere. Sea glass here is quiet most days, loud after storms, and always comparative against river-driven sediment inflow.
Hatteras Island, North Carolina – Barrier Islands on the Move
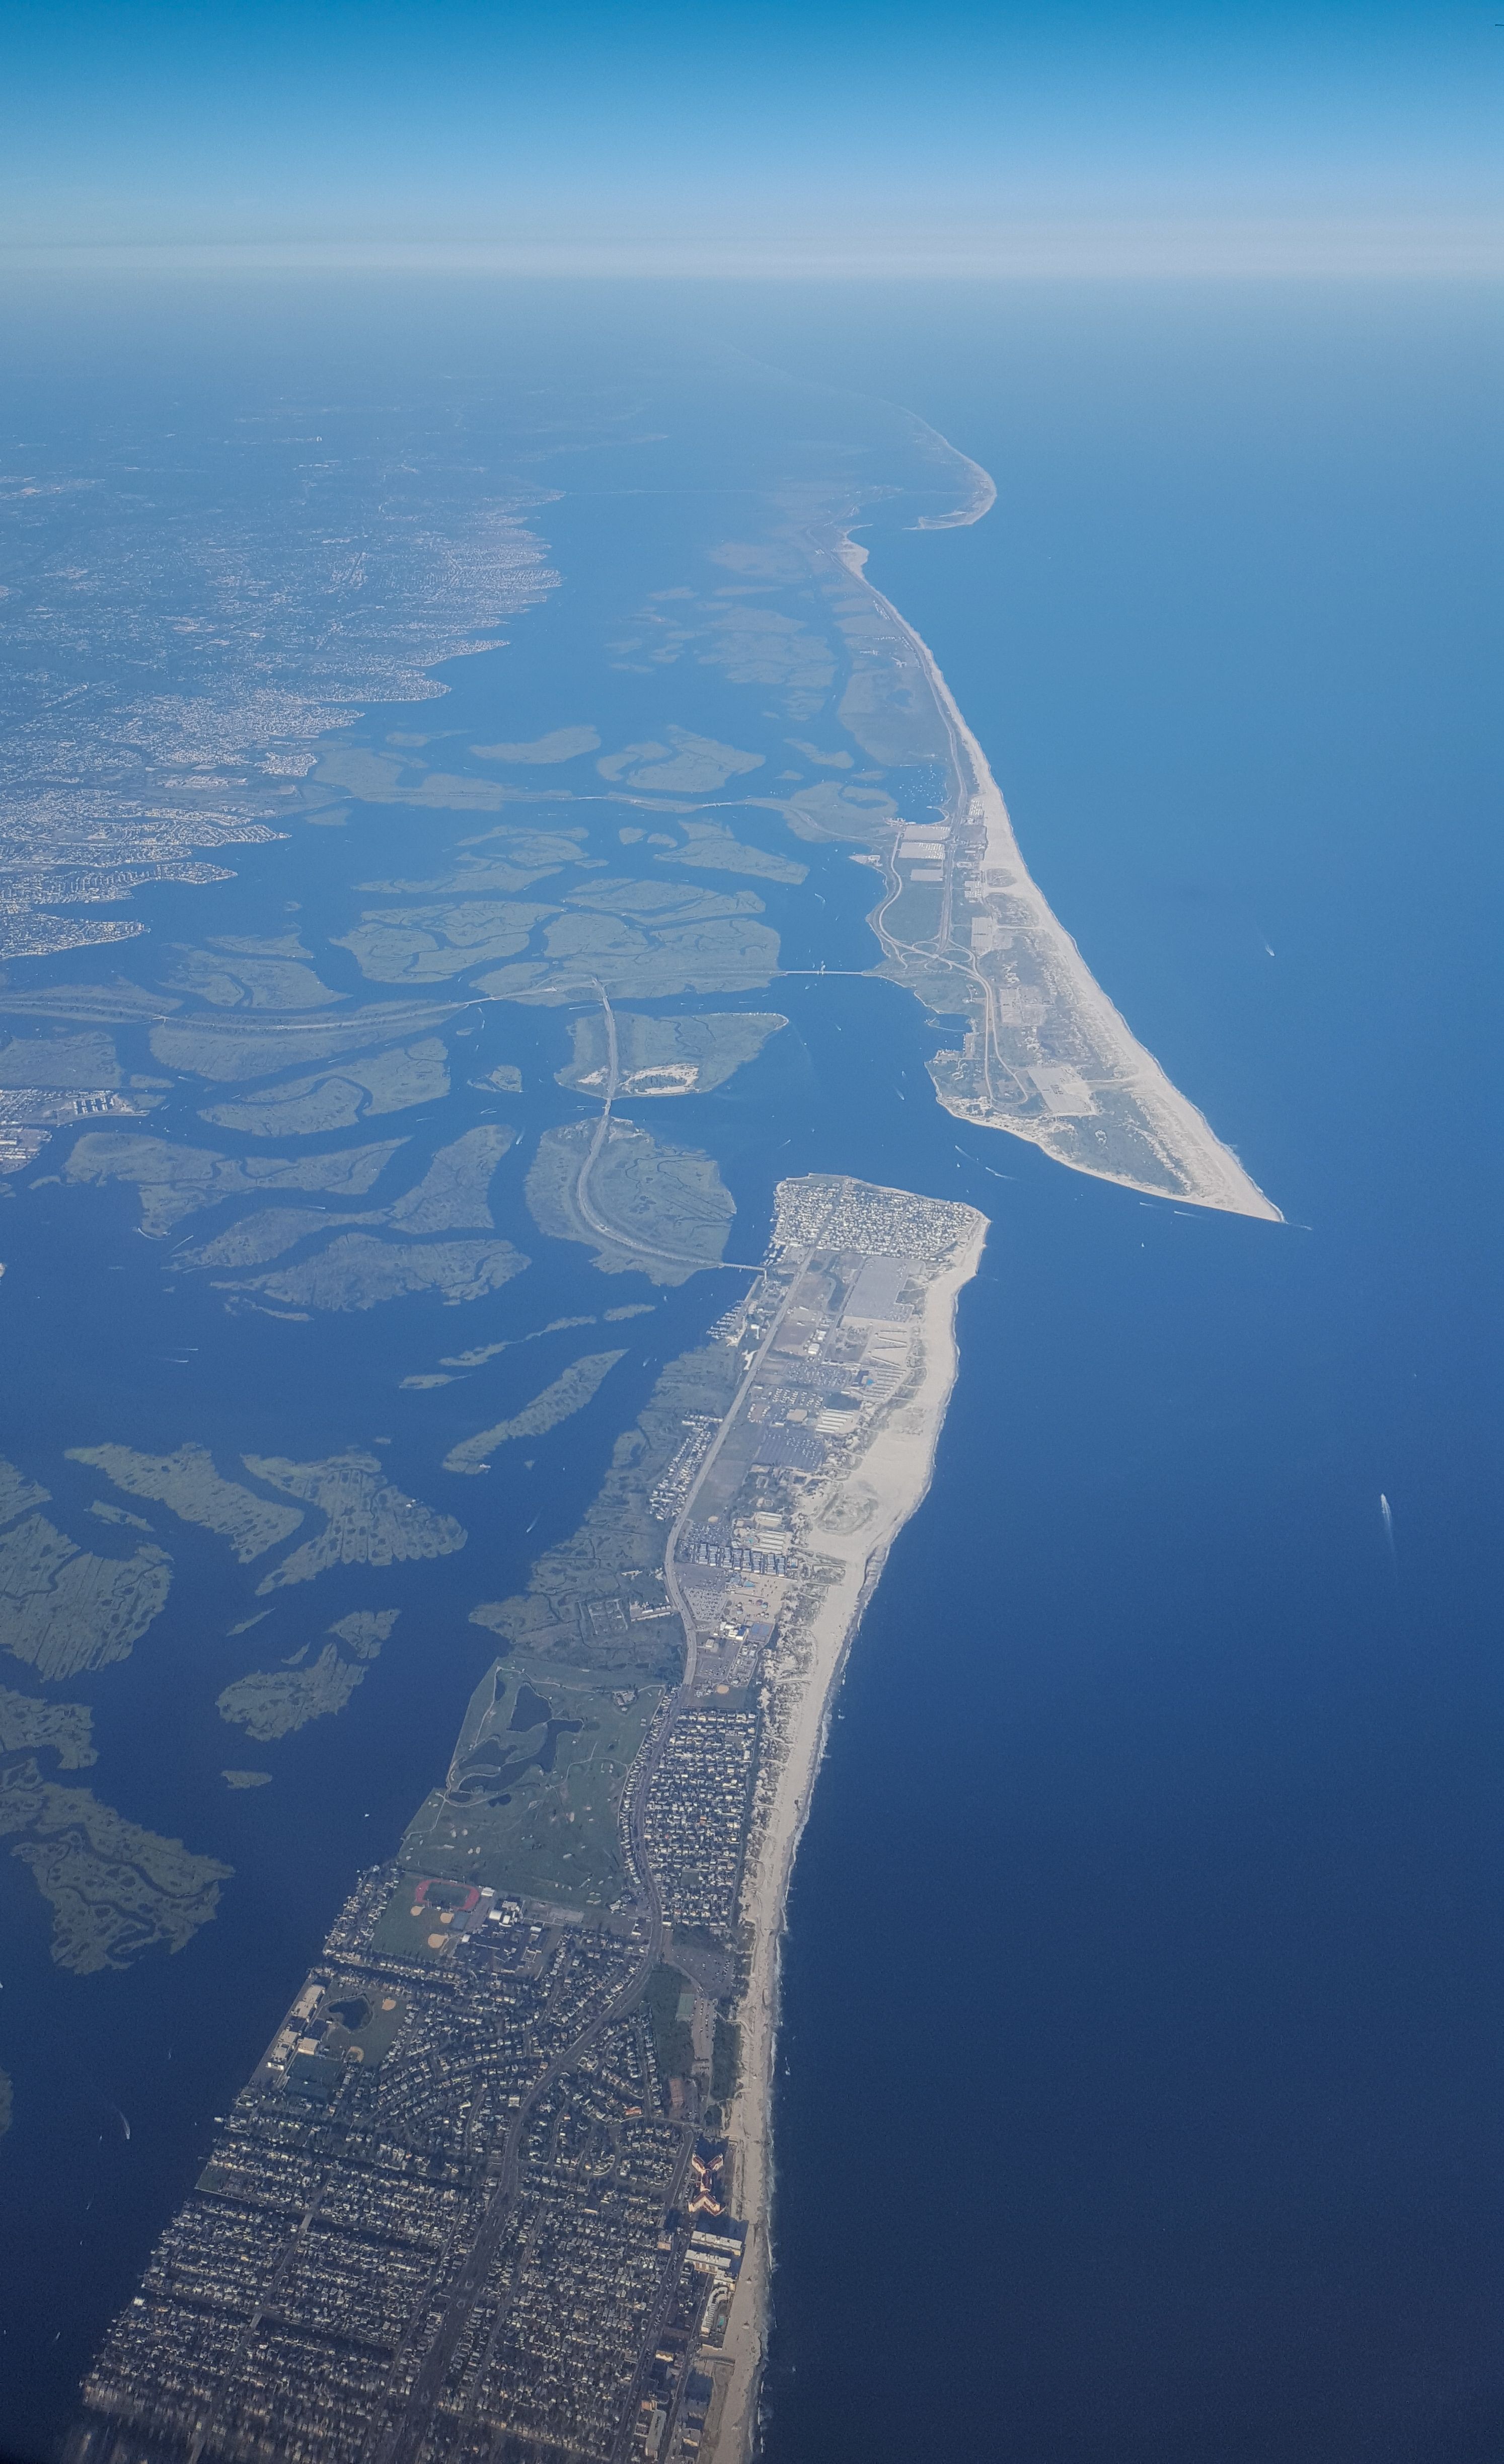
Along the Outer Banks, sandbars migrate, inlets open and close, and the whole barrier chain inches landward. In that restless setting, sea glass rarely sits still; it rides the longshore current like a commuter train. Rounded pieces found high on the beach after tropical systems hint at long, energetic rides punctuated by landfalls at storm berms.
The mix of shell hash and quartz sand acts as abrasive grit, accelerating edge rounding. Where the beach face steepens, backwash strengthens, and thicker shards concentrate in narrow bands you can trace like contour lines. It’s dynamic cartography, with glass as the ink.
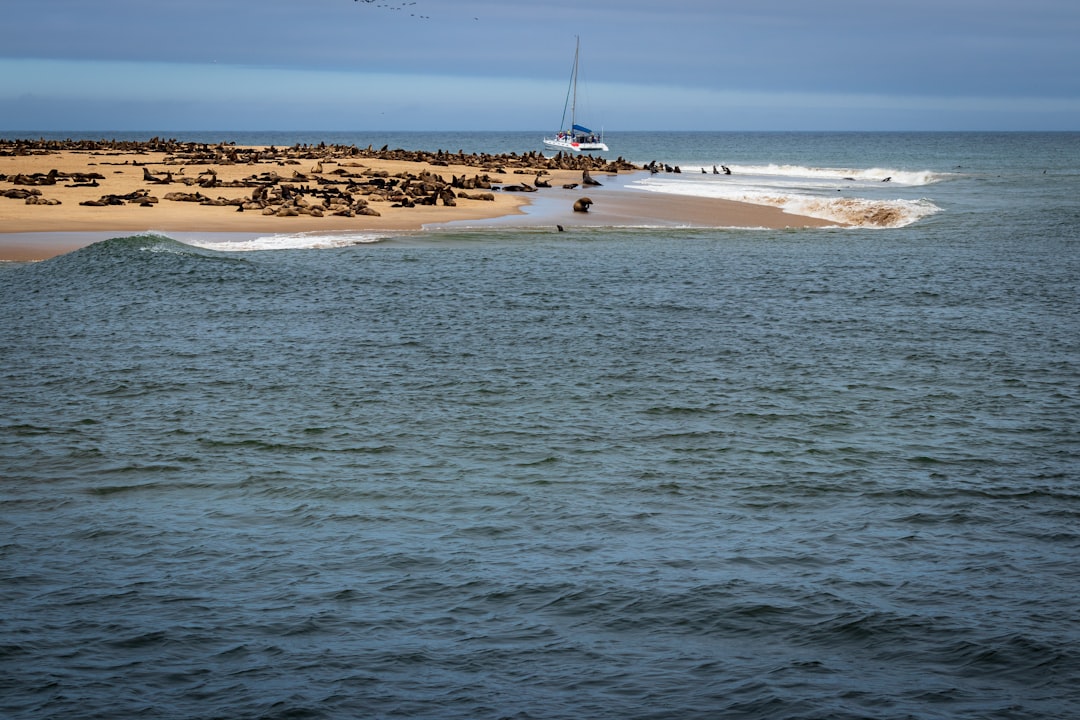
Tybee Island, Georgia – River Plumes and Shipping Lanes
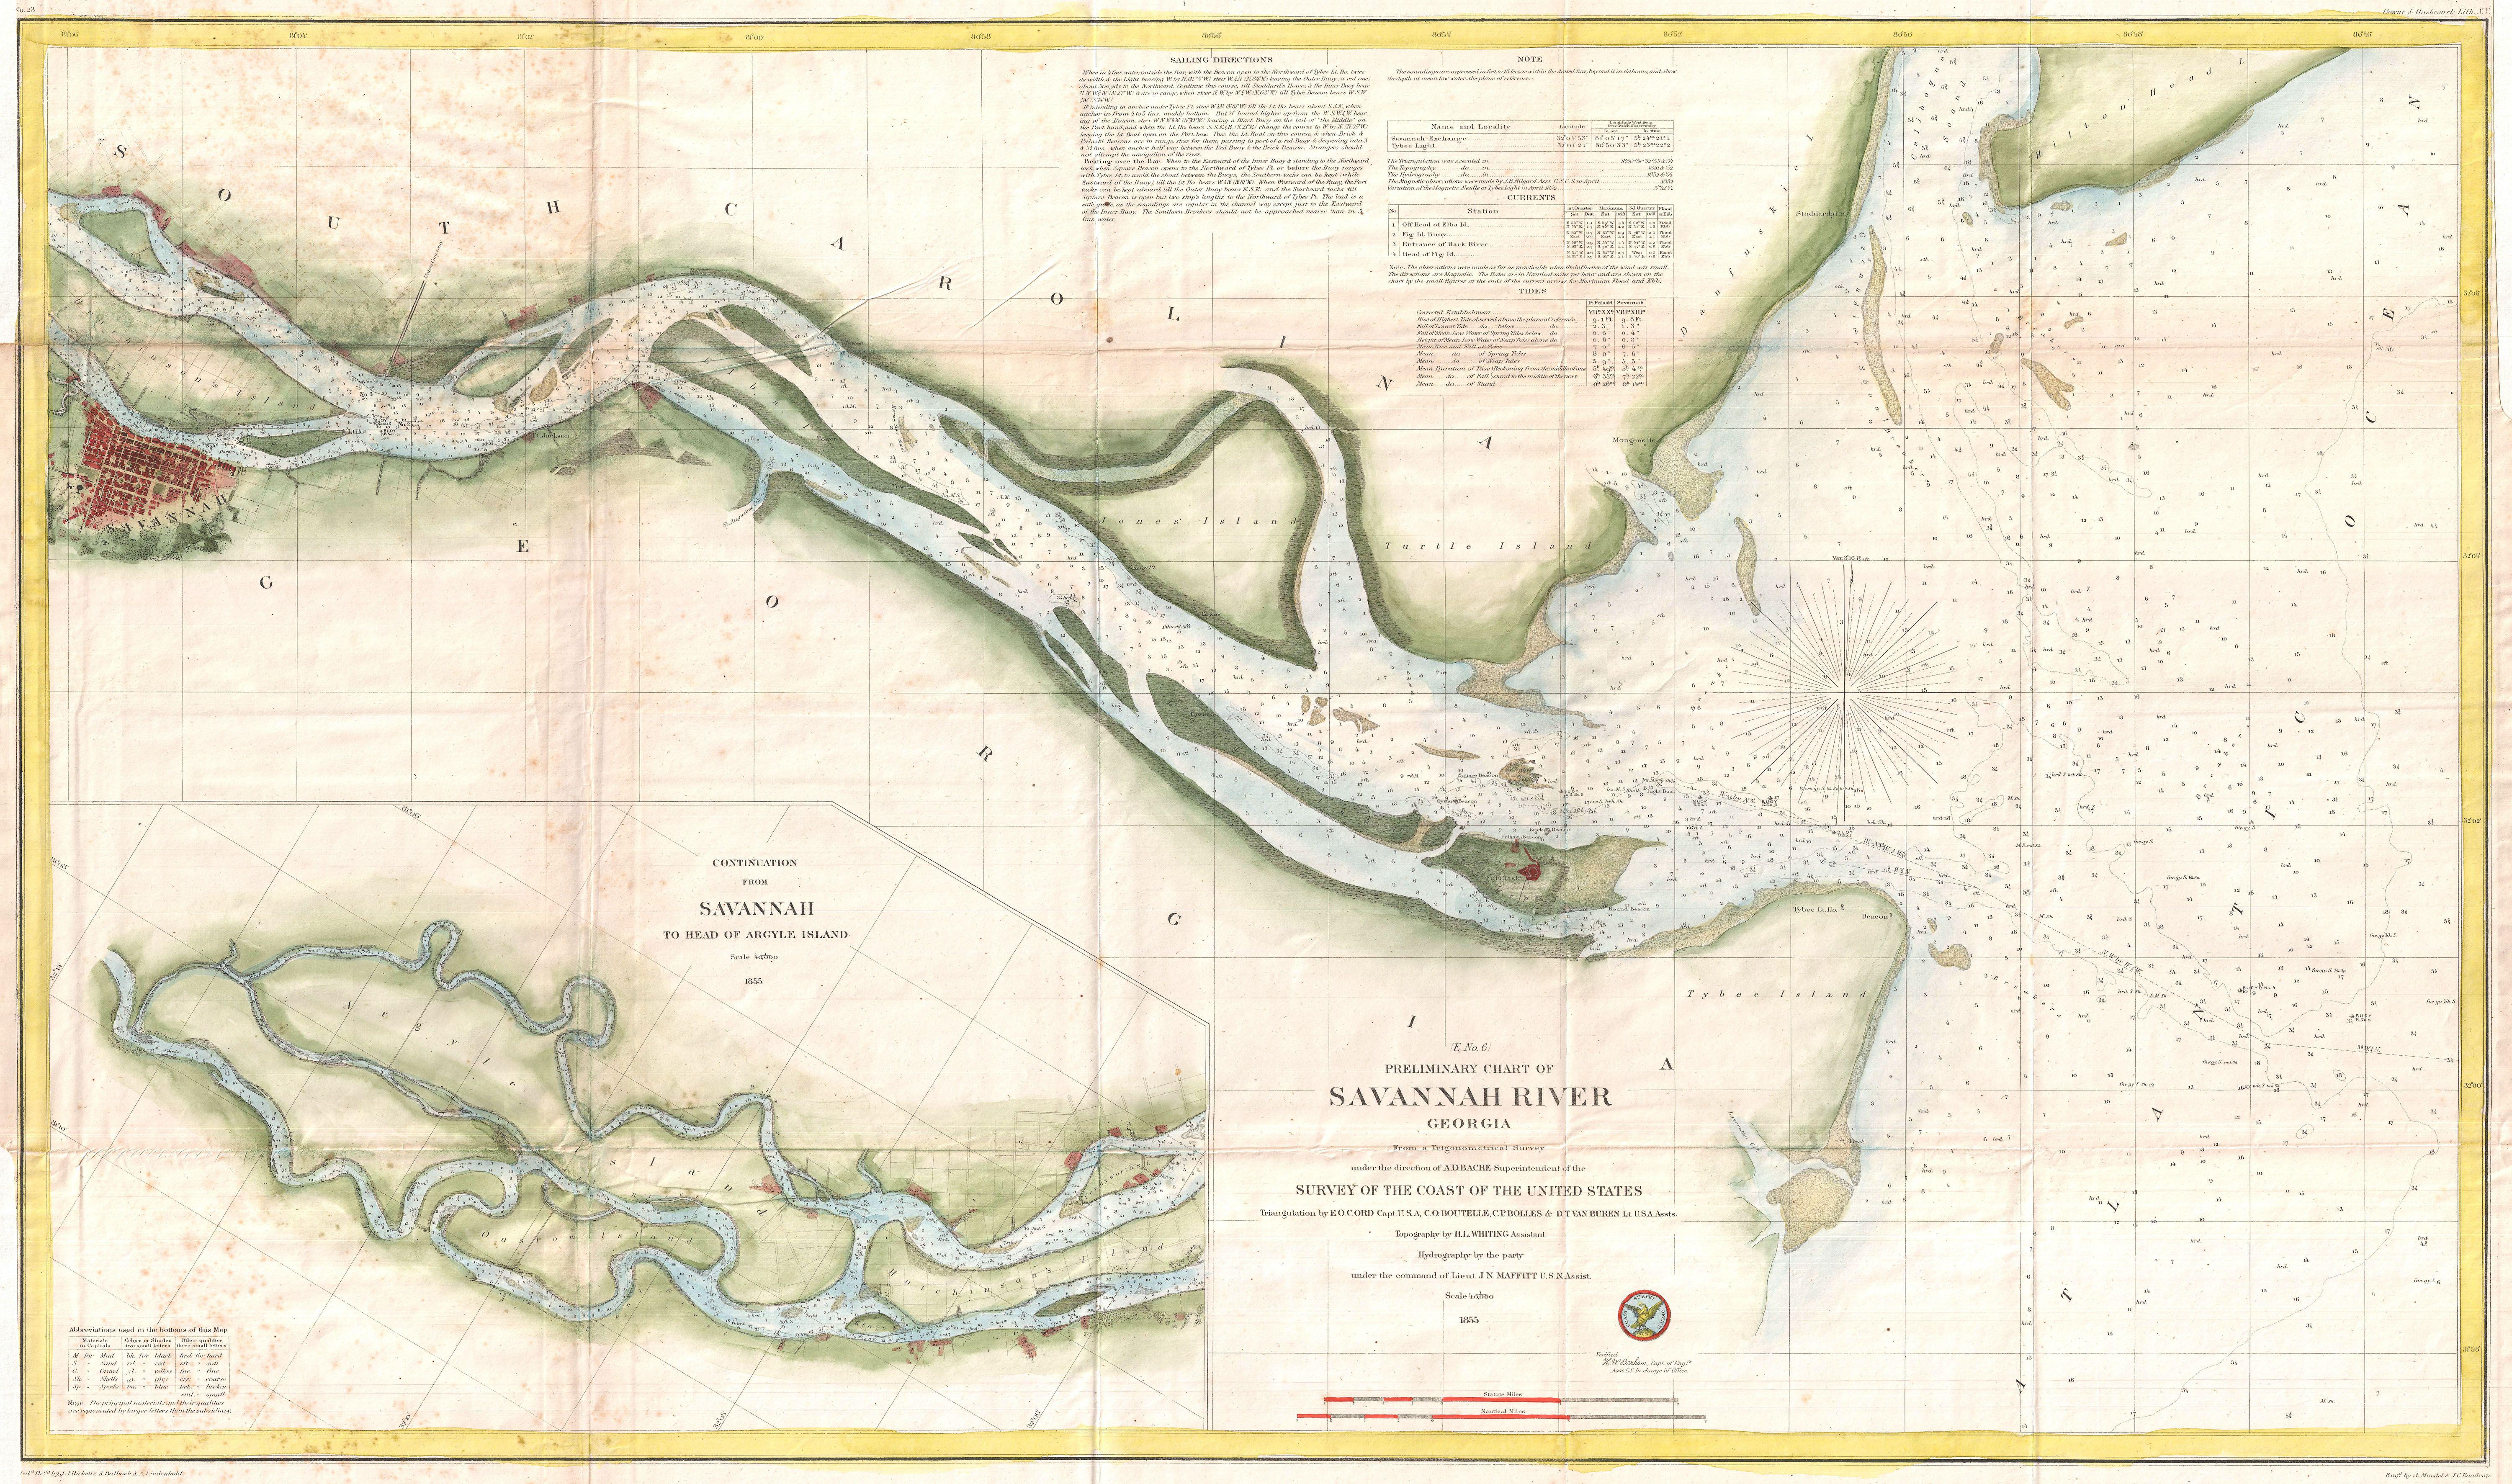
Tybee sits in the shadow of the Savannah River mouth, where plume dynamics and dredged channels steer sediment and debris. Glass here often tells a port story – browns and greens again – with edges softened by warm, carbonate-rich waters. The river’s fine silt can actually slow abrasion between storms, but when onshore winds rise, the system flips and rounds accelerate.
Jetties shape the littoral drift, creating capture zones that hoard lighter fragments. Watch after spring blows and you’ll see color bands appear where the current slackens. Each band is a boundary between forces, a subtle map of engineered and natural flow.
Folly Beach, South Carolina – Why It Matters, and What You Can Do
Folly’s wide, gently sloped foreshore is a tidy place to understand why these shards are more than souvenirs. Sea glass is a tracer: its size, frosting, and color distribution reveal wave climate, shoreline geometry, and human inputs as clearly as tagged sand does in formal studies. In a century of rising seas and shifting storm tracks, those clues help coastal communities read change in real time. I’ve learned to watch the frosted pieces like weather vanes, sensing when the ocean has turned a new page.
Simple, careful habits protect both science and shorelines. Photograph, don’t pocket, in protected areas; check local rules before collecting anywhere. Join a beach monitoring group, log color and size in community science apps, and report unusual concentrations after storms to local coastal managers. Small acts keep the glassy ledger legible – and keep the coast’s ongoing story intact.

Suhail Ahmed is a passionate digital professional and nature enthusiast with over 8 years of experience in content strategy, SEO, web development, and digital operations. Alongside his freelance journey, Suhail actively contributes to nature and wildlife platforms like Discover Wildlife, where he channels his curiosity for the planet into engaging, educational storytelling.
With a strong background in managing digital ecosystems — from ecommerce stores and WordPress websites to social media and automation — Suhail merges technical precision with creative insight. His content reflects a rare balance: SEO-friendly yet deeply human, data-informed yet emotionally resonant.
Driven by a love for discovery and storytelling, Suhail believes in using digital platforms to amplify causes that matter — especially those protecting Earth’s biodiversity and inspiring sustainable living. Whether he’s managing online projects or crafting wildlife content, his goal remains the same: to inform, inspire, and leave a positive digital footprint.