California’s climate can feel like a paradox: glacial cold on the mountaintops, blistering heat on the valley floor, and ocean breezes that turn on a dime. In recent years, that paradox has delivered not just surprises but genuine shocks – records that snapped long-held benchmarks and rewrote local expectations. Behind every headline is a story of physics meeting geography, and of people adapting in real time. This is a tour through the state’s most jaw-dropping weather milestones, why they happened, and what they mean for the future.
A Furnace of a Day: Death Valley’s 134°F
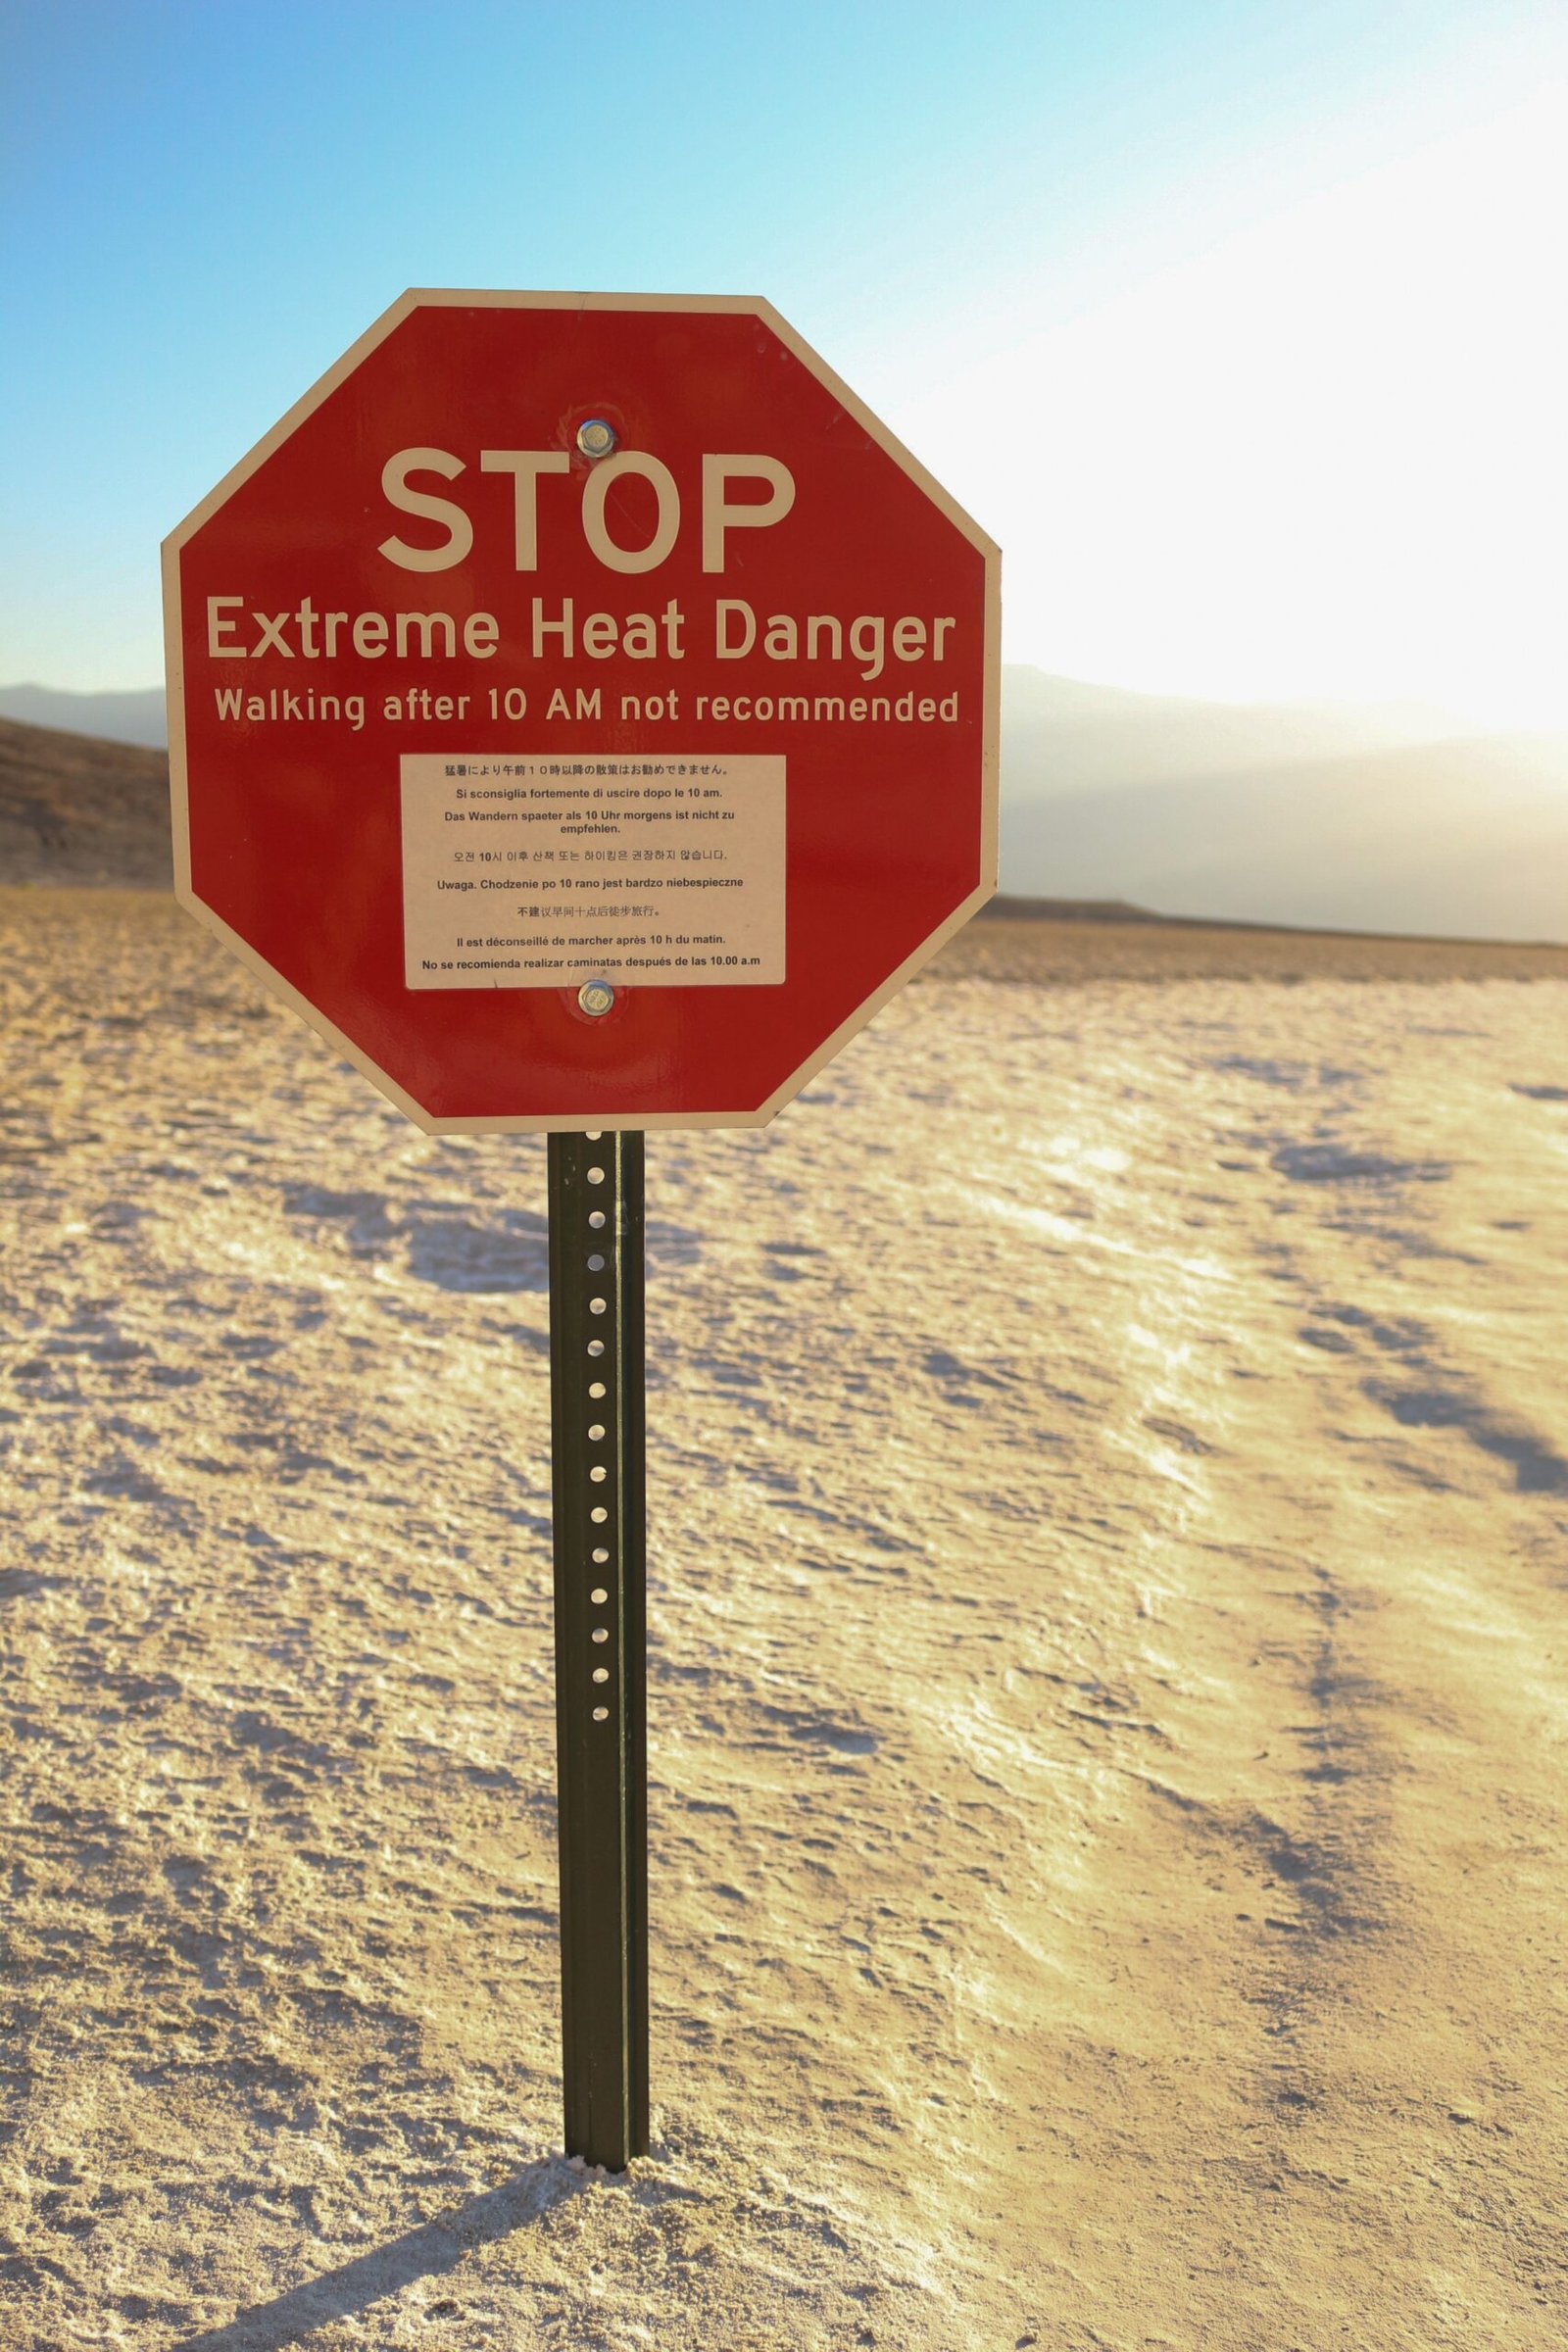
It’s the number that makes even seasoned desert dwellers blink: one hundred and thirty-four degrees in Death Valley’s Furnace Creek, set in early July over a century ago. Step outside in that heat and it feels like opening an oven door – only the oven is the world. What makes Death Valley so extreme is a ruthless combination of low elevation, a basin that traps heat, bone-dry air, and summer sun that turns rock and soil into radiant heaters. The heat bounces between slopes and ground, building on itself like an echo that won’t fade. That day stands as a stark reminder of how geography can push temperature to the edge of what humans can safely endure.
I’ve camped nearby in spring and still felt the ground radiate warmth after dark, like a sleeping dragon under the tent floor. Imagine that amplified by midsummer, with asphalt softening and car dashboards reading numbers that look unreal. Even if we rarely brush against that old record now, modern heat waves stack more hot days and hotter nights, stressing power grids and turning simple errands into endurance tests. It’s a dry-heat legend, yes – but one that still casts a long, heated shadow.
Ice in the Golden State: Boca’s Bitter -45°F
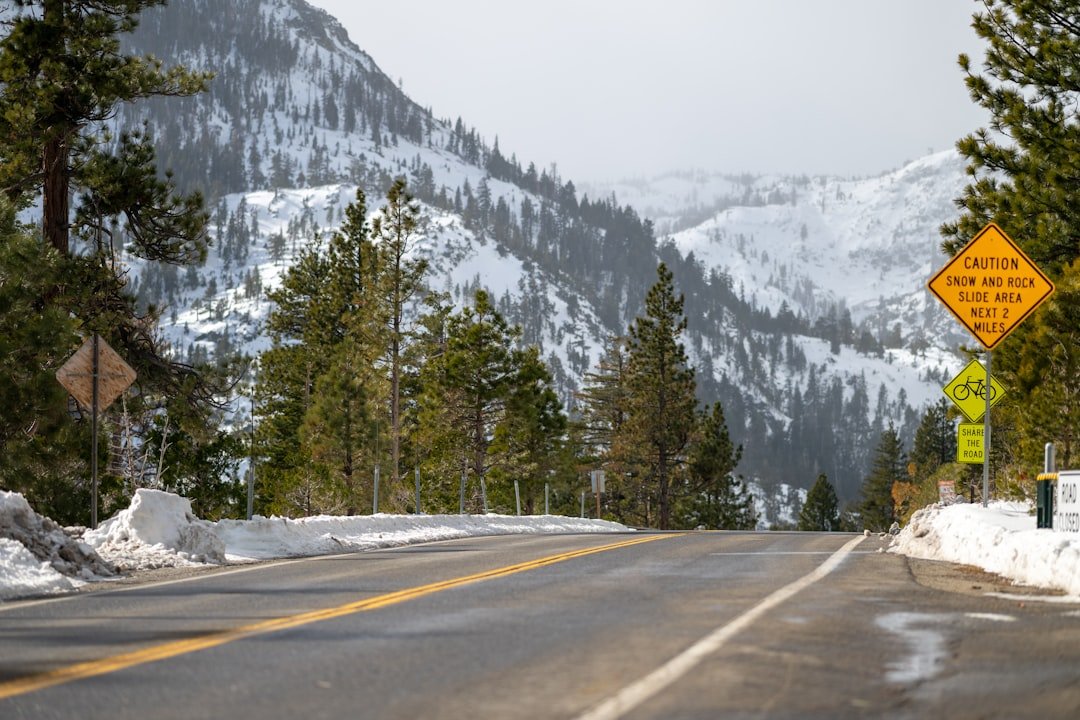
California’s coldest temperature – forty-five below zero – arrived in the mountain pocket near Boca, outside Truckee, back in midwinter long ago. The Sierra Nevada can flip the script from beach posters to Arctic postcards with shocking speed. Snowy ground reflects sunlight, nights run long, and dense cold air slides into basins like water, pooling where the wind goes silent. In that stillness, heat escapes to the sky, and thermometers plunge beyond what the mind expects from a state famous for citrus groves.
The number is more than trivia; it’s a lesson in topography and radiational cooling. Protection from wind, high elevation, and clear skies create a freezer effect you can almost hear in the crunch of snow underfoot. Locals know it means frozen pipes, stalled batteries, and a crisp, crystalline quiet. When California does cold, it does it with mountain drama.
Walls of White: Sierra Snow Depth at Tamarack
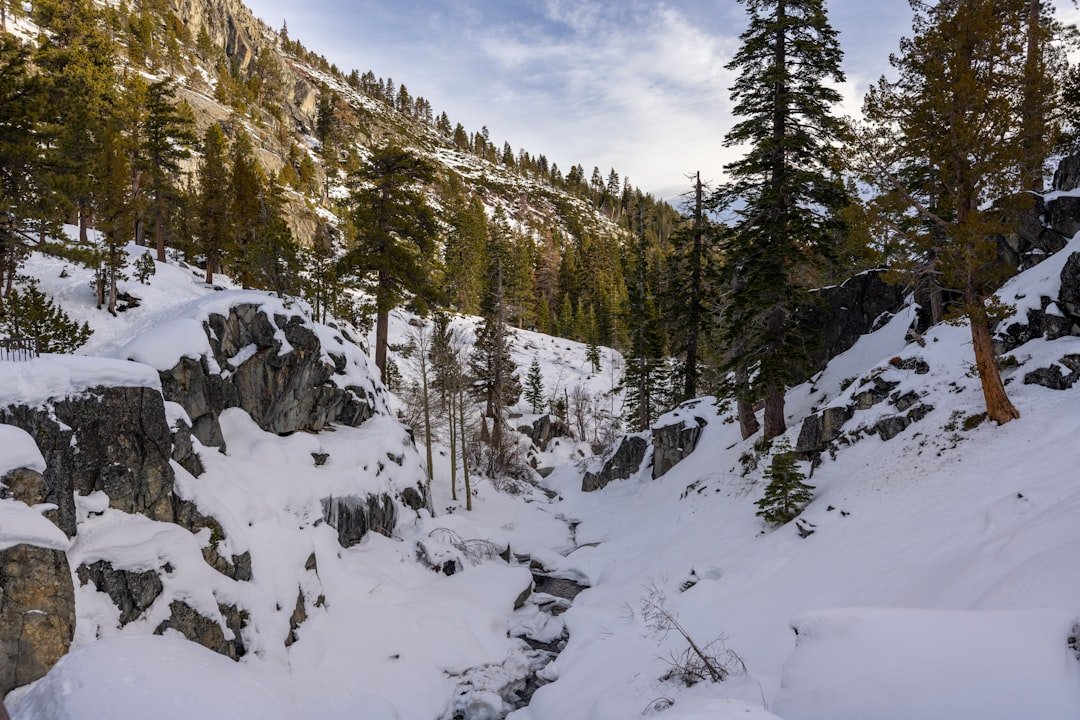
At Tamarack in the central Sierra, snow once stacked to a depth measured not in inches but in stories – more than thirty-seven feet of layered winter. It’s the kind of number that makes roofs groan, doorways disappear, and pine trees wear crowns of rime. Heavy Pacific storms slam into the Sierra’s granite wall, and moist air is forced up, cooled, and squeezed into snow, storm after storm. Over weeks, that snow compacts and deepens, a slow-motion avalanche of accumulation that buries the landscape in silence.
If you’ve ever dug a car out after a weekend blizzard, imagine doing it all season. Snowpack that deep is nature’s savings account for spring, feeding rivers and reservoirs when the thaw arrives. It’s beautiful and brutal, a powder paradise with real-world consequences for roads, power lines, and the people who call the mountains home.
Twenty-Six Inches in a Day: The San Gabriel Cloudburst
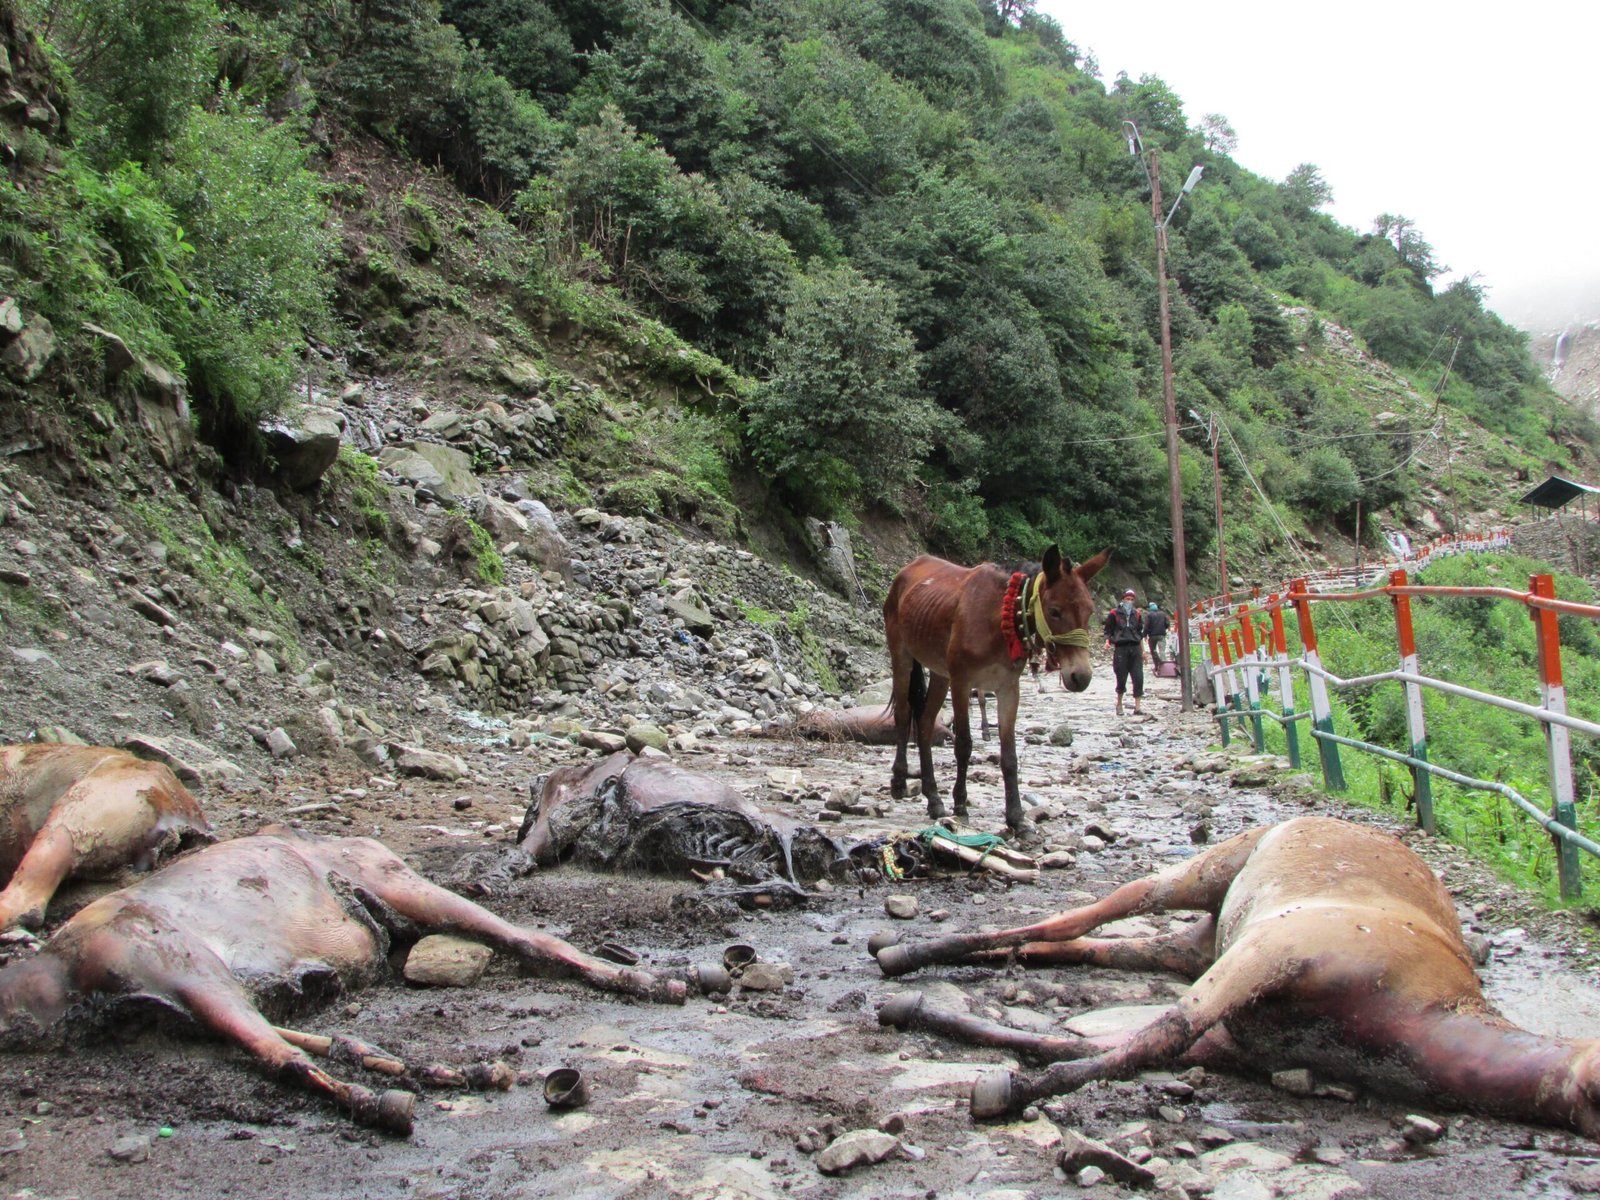
In the San Gabriel Mountains, an infamous winter deluge dumped roughly twenty-six inches of rain in a single day at a secluded camp. That kind of rainfall turns creeks into battering rams and canyon walls into conveyor belts of mud and debris. The setup is a classic: tropical moisture pipes into Southern California, hits mountains at a right angle, and wrings out like a soaked sponge. Orographic lift does the rest, stacking rainfall totals at elevations where storms stall.
For residents, these are nights when phones chirp with alerts and headlights catch rockfall on winding roads. It’s not just the volume; it’s the intensity, the way minutes matter in flash floods. The lesson is simple and sobering: topography decides where the bullseye lands, and sometimes that bullseye doesn’t blink for hours.
Bomb Cyclone, Record Day: Sacramento’s Soaker
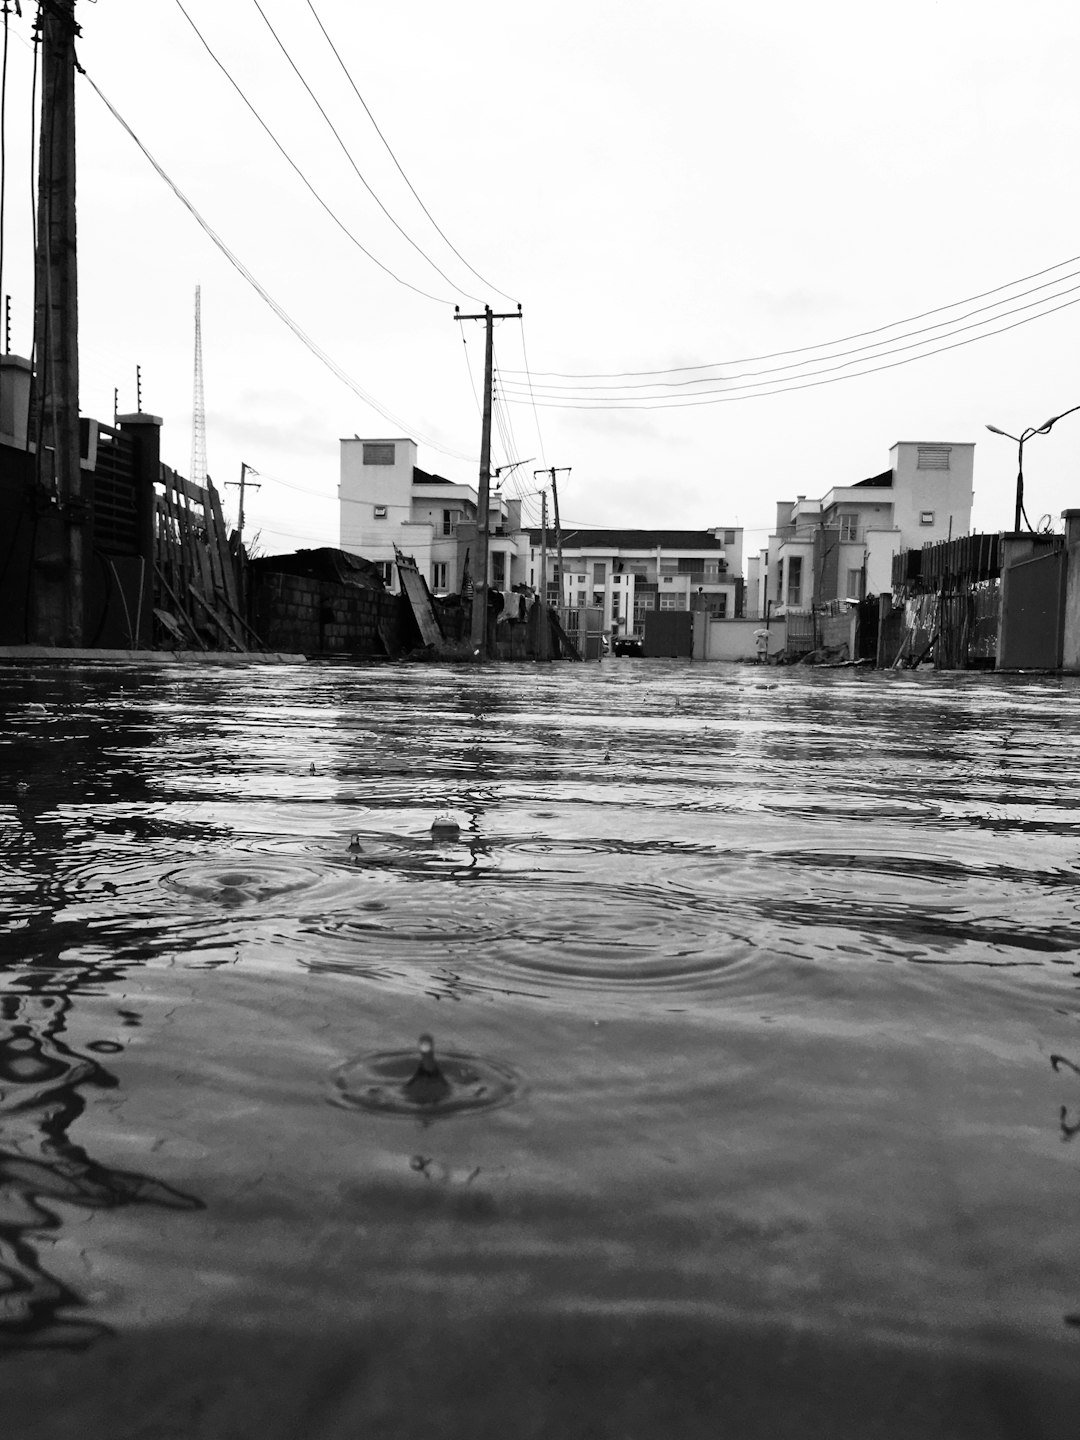
When a powerful Pacific storm rapidly intensified offshore in late October a few years back, Sacramento recorded its wettest single day since measurements began. Streets became temporary streams, and backyards looked like shallow ponds as inches piled up faster than drains could cope. The culprit was an atmospheric river anchored to a deep low-pressure system – meteorology’s version of a fire hose locked in place. Embedded thunderstorms added bursts of tropical-like rain, pushing totals into the record books.
I remember scrolling storm cams and watching gutters spill like waterfalls, thinking how quickly normal can flip to historic. That day was a crash course in how a shifting jet stream and warm ocean feed stronger, slower-moving plumes of moisture. The region exhaled when the tap finally turned, but the after-action showed a city testing the limits of its drainage playbook.
The Snowpack That Stunned: Spring 2023’s Mountain Bounty
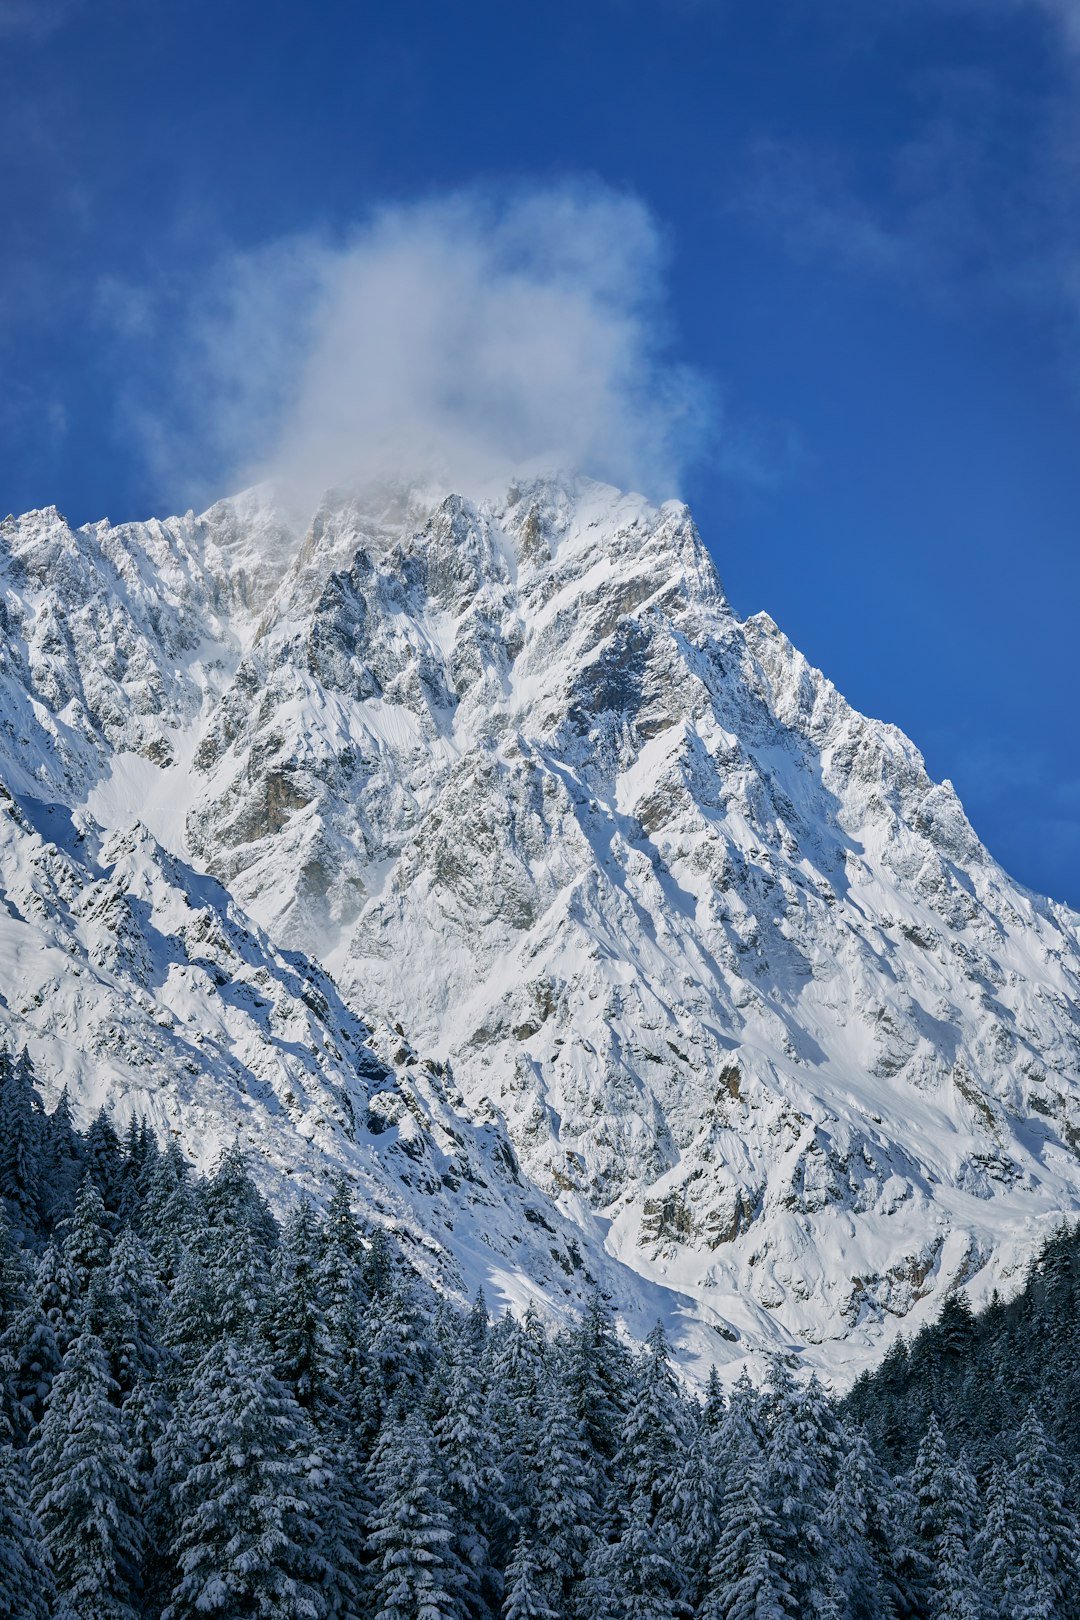
By early April 2023, California’s Sierra snowpack swelled to one of the largest totals observed in modern records, a mountain-scale surprise after punishing drought. Multiple atmospheric rivers chained together, each storm layering dense, water-rich snow on the last. Snow labs measured snow water content at roughly two to three times typical values in several basins, numbers that translate directly to spring runoff. Water managers went from ration talk to dam-management chess, timing releases as if the reservoirs were delicate instruments.
Communities downstream felt the double edge: an end to dry taps on the horizon, and a new worry about levees in long, warm melts. Ski resorts cheered, roofs creaked, and river forecasters worked overtime. It was a reminder that drought’s opposite can arrive abruptly – and demand its own kind of resilience.
Ridge-Top Fury: A 199 mph Sierra Gust
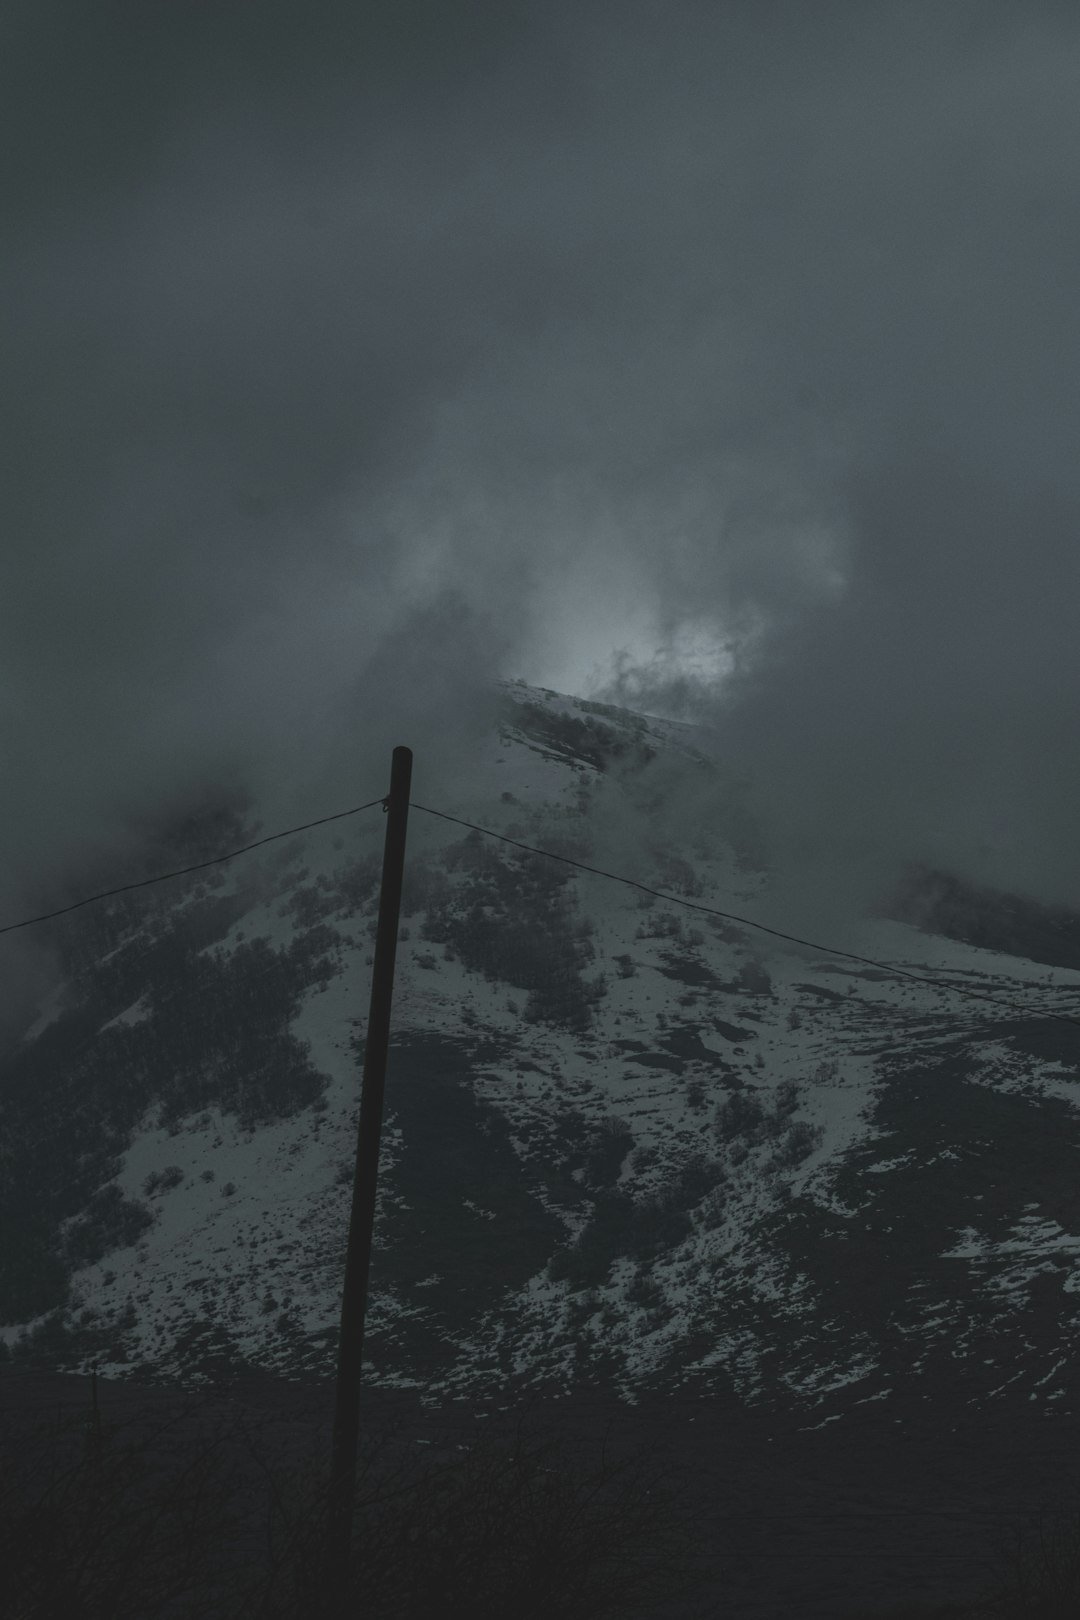
Along a high Sierra ridge near a well-known Tahoe resort, an anemometer reportedly clocked a gust near two hundred miles an hour during a fierce winter storm. That’s jet-aircraft wind, the kind that rips snow into shimmering plumes and turns chairlifts into swaying pendulums. Mountain waves and tight pressure gradients amplified the flow, while terrain funneled wind into a brutal corridor. On the ground, trees surrendered like matchsticks, and roads closed under volleys of whiteout bursts.
Wind at that scale is its own hazard, separate from rain or snow totals. It knocks out power, topples trucks, and makes rescue flights dicey. The reading stands as a testament to just how wild the Sierra’s sky can be when the atmosphere stacks the deck.
The Ocean Ran a Fever: Scripps Pier’s Warmest Day

On a blazing midsummer day in San Diego, the ocean itself set a record when instruments at Scripps Pier logged the warmest sea-surface reading in more than a century of measurements. Surfers waded into water that felt almost tropical, a surreal twist for a coastline famous for chilly Pacific currents. A marine heatwave had muscled in, tamping down coastal upwelling and leaving a layer cake of warm water hugging the shore. Kelp forests and tidepools felt the stress in silence.
Warm coastal seas don’t just change beach vibes; they can ripple through fisheries, strengthen coastal storms, and juice humid heat onshore. For a few days, San Diego wore the Caribbean’s colors, and it looked gorgeous – until you thought about the ecological bill arriving later. Records like that are postcards from a warming ocean.
Hilary’s Curveball: The First Tropical Storm Warning for SoCal
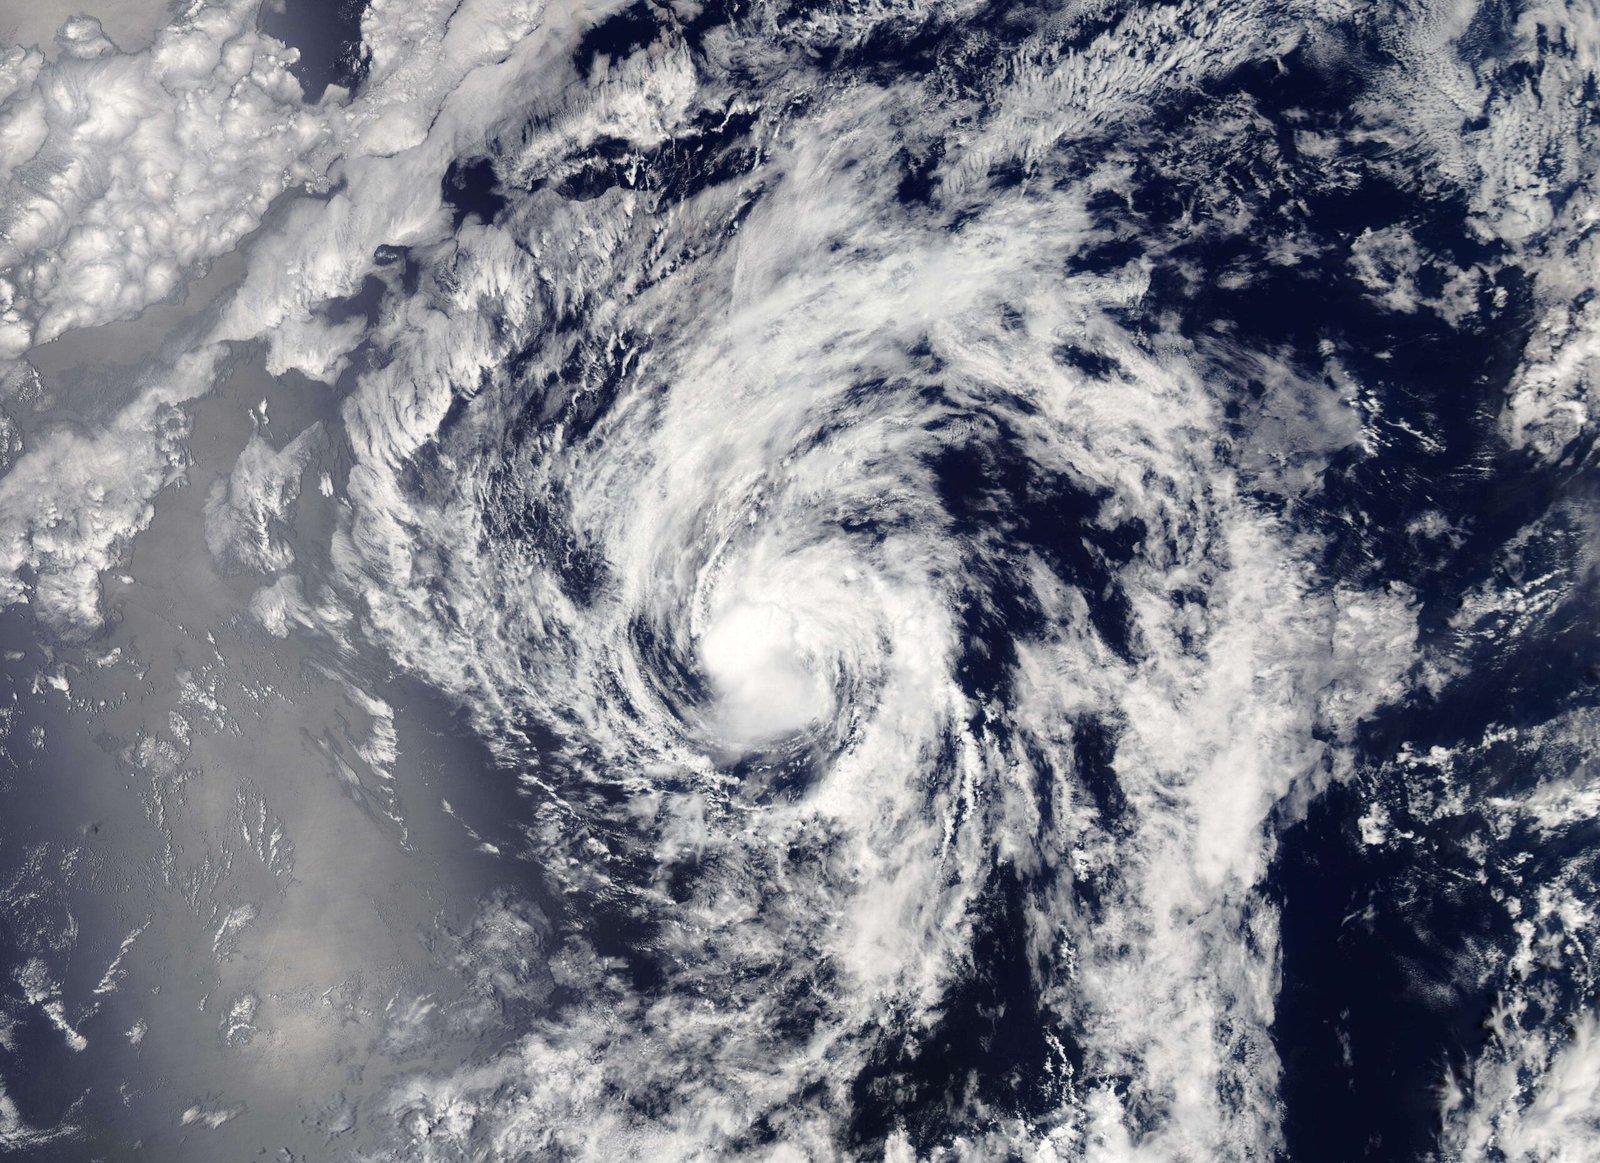
In August 2023, Southern California woke to a phrase that felt impossible: a tropical storm warning, the first ever issued for the region. Hilary’s remnants barreled north with unusual speed, shattering daily rainfall records from the desert to the mountains. Streets in Palm Springs swirled with runoff, dry washes became live rivers, and hikers learned why “flash” is the operative word in flash flood. The storm’s track was a meteorological zigzag, steering warm-core moisture into terrain primed to amplify it.
The episode didn’t turn Los Angeles into Miami, but it cracked the door on a future where tropical leftovers pay more frequent visits. Preparedness plans updated overnight, and flood maps got a fresh look. Few mornings have felt as surreal as the one where a hurricane’s name headlined West Coast forecasts.
When Los Angeles Felt Subtropical: The February 2024 Deluge

Los Angeles saw one of its most intense multi-day winter rain episodes in early February 2024, with totals in some neighborhoods rivaling long-standing event records. Hillsides slumped after hours of soaking, sirens echoed on canyon roads, and residents learned the vocabulary of atmospheric rivers the hard way. A persistent plume of Pacific moisture parked over the basin, with low-level winds steering showers against the Transverse Ranges like waves against a cliff. Bursts of convection turned steady rain into hour-long torrents.
By the end, reservoirs climbed, storm drains hissed, and the city tallied a once-in-years soaking that residents felt in their bones. The event didn’t take the all-time crown in every gauge, but it showed how close modern storms can come – and how quickly – when the ocean and jet stream align. The city dried out, changed a few habits, and waited for the next tap to turn.
Why It Matters
Weather records are not just trophies for trivia night; they’re stress tests for our systems. Roads, levees, grids, and hospitals are designed around expectations, and records tell us when those expectations break. Historically, Californians counted on patterns – wet winters, dry summers, gentle marine layers – to calibrate life. Now, the extremes are stretching the pattern, and yesterday’s outliers are creeping closer to the average line.
Compared with the past, the new playbook demands more flexible water storage, smarter evacuation maps, and building codes tuned to heat and flood. The signals are clear: long heat waves, juiced downpours, and erratic snow years are making risk less seasonal and more year-round. If you plan a city like it’s 1980, you feel 2025 the hard way.
The Future Landscape
Looking ahead, better forecasts will come from denser radar coverage, high-resolution models that resolve mountain valleys, and satellites that see through clouds to the rain beneath. Smarter infrastructure – permeable streets, targeted recharge basins, modular microgrids – can bend without breaking when storms or heat waves lean in. Water managers are already testing dynamic operations that shift reservoir levels based on incoming storm probabilities, not calendar dates. Coastal planners are pairing tide gauges with flood cameras to capture nuisance flooding before it becomes news.
Globally, California’s story mirrors a wider arc: warmer oceans feeding extreme rain, snow systems that flip between feast and famine, and heat that lingers after sunset. The challenge is turning data into decisions fast enough to matter. The upside is that many fixes are shovel-ready; the hurdle is willpower, not know-how.
How You Can Engage

Sign up for local alerts, learn your flood and fire zones, and practice a two-minute drill for power outages and evacuations. Support projects that cool neighborhoods – trees, reflective roofs, shaded bus stops – because a cooler block is a safer block in a heat wave. If you own property, check your drainage, clear gutters before big storms, and keep an emergency kit that’s boring until the day it isn’t. Back science education and community weather networks; more observations mean better forecasts for your street, not just your county.
Simple steps stack up: carpool or ride transit on ozone-prone days, back water recycling even when reservoirs look full, and ask local officials how they’re incorporating new climate data into plans. The future will still surprise us, but you don’t have to be surprised unprepared.

Suhail Ahmed is a passionate digital professional and nature enthusiast with over 8 years of experience in content strategy, SEO, web development, and digital operations. Alongside his freelance journey, Suhail actively contributes to nature and wildlife platforms like Discover Wildlife, where he channels his curiosity for the planet into engaging, educational storytelling.
With a strong background in managing digital ecosystems — from ecommerce stores and WordPress websites to social media and automation — Suhail merges technical precision with creative insight. His content reflects a rare balance: SEO-friendly yet deeply human, data-informed yet emotionally resonant.
Driven by a love for discovery and storytelling, Suhail believes in using digital platforms to amplify causes that matter — especially those protecting Earth’s biodiversity and inspiring sustainable living. Whether he’s managing online projects or crafting wildlife content, his goal remains the same: to inform, inspire, and leave a positive digital footprint.